by Calculated Risk on 4/08/2024 02:59:00 PM
Monday, April 08, 2024
Hotels: Occupancy Rate Decreased 5.6% Year-over-year Due to Easter Holiday
As expected ahead of the Easter holiday, U.S. hotel performance decreased from the previous week, according to CoStar’s latest data through 30 March.The following graph shows the seasonal pattern for the hotel occupancy rate using the four-week average.
24-30 March 2024 (percentage change from comparable week in 2023):
• Occupancy: 62.3% (-5.6%)
• Average daily rate (ADR): US$157.14 (-0.7%
• Revenue per available room (RevPAR): US$97.83 (-6.3%)
emphasis added
 Click on graph for larger image.
The red line is for 2024, black is 2020, blue is the median, and dashed light blue is for 2023. Dashed purple is for 2018, the record year for hotel occupancy.
1st Look at Local Housing Markets in March
by Calculated Risk on 4/08/2024 01:04:00 PM
Today, in the Calculated Risk Real Estate Newsletter: 1st Look at Local Housing Markets in March
A brief excerpt:
NOTE: The tables for active listings, new listings and closed sales all include a comparison to March 2019 for each local market (some 2019 data is not available).There is much more in the article.
This is the first look at several early reporting local markets in March. I’m tracking about 40 local housing markets in the US. Some of the 40 markets are states, and some are metropolitan areas. I’ll update these tables throughout the month as additional data is released.
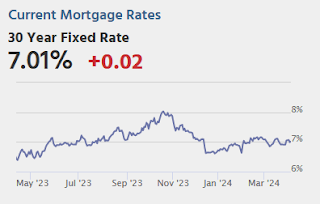
Closed sales in March were mostly for contracts signed in January and February when 30-year mortgage rates averaged 6.44% and 6.78%, respectively. This is down from the 7%+ mortgage rates in the August through November period (although rates are now back in the 7% range again).
...
In March, sales in these markets were down 8.9% YoY. In February, these same markets were up 2.3% year-over-year Not Seasonally Adjusted (NSA).
Sales in all of these markets are down compared to January 2019.
...
This is a year-over-year decrease NSA for these early reporting markets. However, there were two fewer working days in March 2024 compared to March 2023, so sales Seasonally Adjusted will be higher year-over-year than Not Seasonally Adjusted sales.
...
This was just a few early reporting markets. Many more local markets to come!
Leading Index for Commercial Real Estate Decreased 9% in March
by Calculated Risk on 4/08/2024 11:01:00 AM
From Dodge Data Analytics: Dodge Momentum Index Fell 9% in March
The Dodge Momentum Index (DMI), issued by Dodge Construction Network, fell 8.6% in March to 164.0 (2000=100) from the revised February reading of 179.5. Over the month, commercial planning fell 3.2% and institutional planning dropped 17.2%.
“In 2023, commercial planning decreased while institutional planning notably improved, sitting 29% above year-ago levels in February 2024. While strong market fundamentals should support institutional planning this year, this side of the Index is more at risk for a substantive correction after last year’s growth,” stated Sarah Martin, associate director of forecasting for Dodge Construction Network. “Much of the decline on the institutional side is credited to lower levels of education planning. Between February 2023 and February 2024, life science and R&D laboratory projects account for roughly 34% of education planning value, with that share reaching 59% in some months. In March, however, that share dropped to 7%. The surge of lab construction in recent years may lead to decreased planning demand as the market absorbs new supply in 2024. Likely, lower lab volumes will result in education planning returning to its long-run, and more sustainable, average.”
...
The DMI is a monthly measure of the value of nonresidential building projects going into planning, shown to lead construction spending for nonresidential buildings by a full year.
emphasis added
 Click on graph for larger image.
This graph shows the Dodge Momentum Index since 2002. The index was at 164.0 in March, down from 179.5 the previous month.
According to Dodge, this index leads "construction spending for nonresidential buildings by a full year". This index suggests a slowdown in 2024.
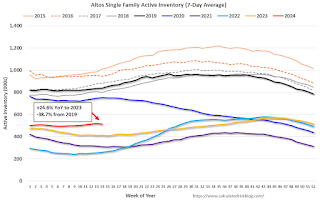
Housing April 8th Weekly Update: Inventory down 0.9% Week-over-week due to Easter Holiday, Up 24.6% Year-over-year
by Calculated Risk on 4/08/2024 08:12:00 AM
 Click on graph for larger image.
This inventory graph is courtesy of Altos Research.

Sunday, April 07, 2024
Sunday Night Futures
by Calculated Risk on 4/07/2024 06:11:00 PM
Weekend:
• Schedule for Week of April 7, 2024
Monday:
• No major economic releases scheduled.
From CNBC: Pre-Market Data and Bloomberg futures S&P 500 are up 14 and DOW futures are up 99 (fair value).
Oil prices were up over the last week with WTI futures at $86.91 per barrel and Brent at $91.17 per barrel. A year ago, WTI was at $80, and Brent was at $87 - so WTI oil prices are up about 8% year-over-year.
Here is a graph from Gasbuddy.com for nationwide gasoline prices. Nationally prices are at $3.58 per gallon. A year ago, prices were at $3.58 per gallon, so gasoline prices are unchanged year-over-year.
AAR: Rail Carloads Down YoY in March, Intermodal Up
by Calculated Risk on 4/07/2024 08:21:00 AM
From the Association of American Railroads (AAR) Rail Time Indicators. Graphs and excerpts reprinted with permission.
Total originated carloads on U.S. railroads fell 3.5% (31,101 carloads) in March 2024 from March 2023, their third straight monthly decline. Total carloads averaged 216,716 per week in March 2024, the fewest for any March in our records that begin in January 1988. In the first quarter of 2024, total carloads were down 4.2%, or 122,088 carloads, from the same period in 2023.
The problem is coal. ...
U.S. railroads also originated 1.02 million intermodal containers and trailers in March, up 11.7% (106,903 units) over March 2023 and their seventh consecutive year-over-year gain.
emphasis added
 Click on graph for larger image.
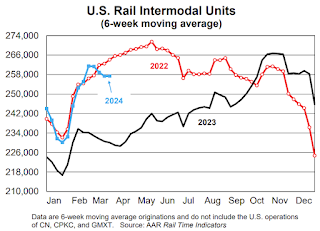
This graph from the Rail Time Indicators report shows the six-week average of U.S. Carloads in 2022, 2023 and 2024:
In March, total originated U.S. carloads fell 3.5% (31,101 carloads) from March 2023. They averaged 216,716 per week in March 2024, the fewest for any March in our records that begin in January 1988. Total carloads were down 4.2%, or 122,088 carloads, for the year to date.
 The second graph shows the six-week average (not monthly) of U.S. intermodal in 2022, 2023 and 2024: (using intermodal or shipping containers):
U.S. railroads originated 1.02 million intermodal containers and trailers in March, up 11.7% (106,903 units) over March 2023. It’s their seventh straight year-over-year gain. ... U.S. intermodal volume in Q1 2024 was 3.27 million units, virtually the same as the average for the first quarters from 2014 to 2023 (3.28 million).
Saturday, April 06, 2024
Real Estate Newsletter Articles this Week: Office Vacancy Rate at Record High
by Calculated Risk on 4/06/2024 02:11:00 PM
At the Calculated Risk Real Estate Newsletter this week:
• Moody's: Apartment Vacancy Rate Unchanged in Q1; Office Vacancy Rate at Record High
• Freddie Mac House Price Index Increased in February; Up 5.9% Year-over-year
• ICE Mortgage Monitor: The Impact of "Golden-Handcuffs" on Mortgage Payments
• Asking Rents Mostly Unchanged Year-over-year
• Immigration and Household Formation
This is usually published 4 to 6 times a week and provides more in-depth analysis of the housing market.
Schedule for Week of April 7, 2024
by Calculated Risk on 4/06/2024 08:11:00 AM
The key economic report this week is March CPI.
No major economic releases scheduled.
6:00 AM ET: NFIB Small Business Optimism Index for March.
7:00 AM ET: The Mortgage Bankers Association (MBA) will release the results for the mortgage purchase applications index.
8:30 AM: The Consumer Price Index for March from the BLS. The consensus is for 0.4% increase in CPI (up 3.5% YoY) and a 0.3% increase in core CPI (up 3.7% YoY).
2:00 PM: FOMC Minutes, Meeting of March 19-20
8:30 AM: The initial weekly unemployment claims report will be released. The consensus is for 225 thousand initial claims, up from 221 thousand last week.
8:30 AM: The Producer Price Index for March from the BLS. The consensus is for a 0.2% increase in PPI, and a 0.3% increase in core PPI.
10:00 AM: University of Michigan's Consumer sentiment index (Preliminary for April).
Friday, April 05, 2024
April 5th COVID Update: Weekly Deaths Decreased
by Calculated Risk on 4/05/2024 07:21:00 PM

| COVID Metrics | ||||
|---|---|---|---|---|
| Now | Week Ago | Goal | ||
| Hospitalized2 | 7,401 | 8,705 | ≤3,0001 | |
| Deaths per Week2 | 1,002 | 1,198 | ≤3501 | |
| 1my goals to stop weekly posts, 2Weekly for Currently Hospitalized, and Deaths 🚩 Increasing number weekly for Hospitalized and Deaths ✅ Goal met. | ||||
 Click on graph for larger image.
This graph shows the weekly (columns) number of deaths reported.
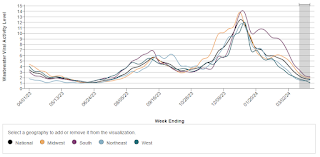
 This appears to be a leading indicator for COVID hospitalizations and deaths.
Q1 GDP Tracking: 2% to 2.5%
by Calculated Risk on 4/05/2024 03:10:00 PM
From BofA:
Since our update last week, 1Q GDP tracking is down two-tenths to 2.0% q/q saar. Also, 4Q GDP came in at 3.4% q/q saar in the third and final estimate, close to our 3.5% forecast. [Apr 5th estimate]From Goldman:
emphasis added
The details of the trade balance report were somewhat firmer than our previous expectations, and we boosted our Q1 GDP tracking estimate by 0.2pp to +2.5%. [Apr 4th estimate]And from the Altanta Fed: GDPNow
The GDPNow model estimate for real GDP growth (seasonally adjusted annual rate) in the first quarter of 2024 is 2.5 percent on April 4, down from 2.8 percent on April 1. [April 4th estimate]


