by Calculated Risk on 4/10/2024 07:00:00 AM
Wednesday, April 10, 2024
MBA: Mortgage Applications Increased in Weekly Survey
From the MBA: Mortgage Applications Increase in Latest MBA Weekly Survey
Mortgage applications increased 0.1 percent from one week earlier, according to data from the Mortgage Bankers Association’s (MBA) Weekly Mortgage Applications Survey for the week ending April 5, 2024.
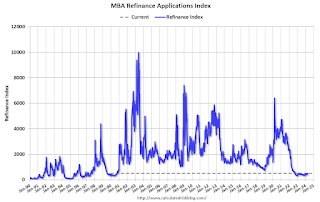
The Market Composite Index, a measure of mortgage loan application volume, increased 0.1 percent on a seasonally adjusted basis from one week earlier. On an unadjusted basis, the Index increased 0.2 percent compared with the previous week. The Refinance Index increased 10 percent from the previous week and was 4 percent higher than the same week one year ago. The seasonally adjusted Purchase Index decreased 5 percent from one week earlier. The unadjusted Purchase Index decreased 4 percent compared with the previous week and was 23 percent lower than the same week one year ago.
“Mortgage rates moved higher last week as several Federal Reserve officials reiterated a patient posture on rate cuts. Inflation remains stubbornly above the Fed’s target, and the broader economy continues to show resiliency. Unexpectedly strong employment data released last week further added to the upward pressure on rates,” said Joel Kan, MBA’s Vice President and Deputy Chief Economist. “The 30-year fixed rate increased to 7.01 percent, the highest in over a month. Purchase applications were down almost five percent to the lowest level since the end of February, but refinance applications were up 10 percent, driven particularly by VA refinance applications.”
...
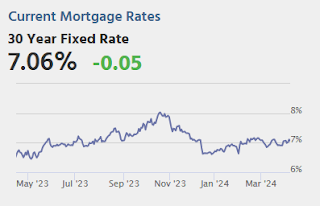
The average contract interest rate for 30-year fixed-rate mortgages with conforming loan balances ($766,550 or less) increased to 7.01 percent from 6.91 percent, with points remaining at 0.59 (including the origination fee) for 80 percent loan-to-value ratio (LTV) loans.
emphasis added
 Click on graph for larger image.
The first graph shows the MBA mortgage purchase index.
According to the MBA, purchase activity is down 23% year-over-year unadjusted.
Tuesday, April 09, 2024
Wednesday: CPI, FOMC Minutes
by Calculated Risk on 4/09/2024 07:43:00 PM
Wednesday:
• At 7:00 AM ET, The Mortgage Bankers Association (MBA) will release the results for the mortgage purchase applications index.
• At 8:30 AM, The Consumer Price Index for March from the BLS. The consensus is for 0.4% increase in CPI (up 3.5% YoY) and a 0.3% increase in core CPI (up 3.7% YoY).
• At 2:00 PM, FOMC Minutes, Meeting of March 19-20<
CPI Preview
by Calculated Risk on 4/09/2024 03:50:00 PM
Currently CPI is a significant market mover, especially for mortgage rates. Here are two previews on the report tomorrow.
From BofA:
After two firm reports to start the year, core CPI inflation should cool off in March. We expect core CPI inflation to round down to 0.2% m/m (0.24% unrounded) owing to a slight decline in core goods prices and less price pressure from core services. Meanwhile, headline CPI should round up to 0.3% m/m (0.25% unrounded). If our forecast proves correct, it should provide some confidence to the Fed.From Goldman:
We expect a 0.27% increase in March core CPI (vs. 0.3% consensus), corresponding to a year-over-year rate of 3.70% (vs. 3.7% consensus). We expect a 0.29% increase in March headline CPI (vs. 0.3% consensus), which corresponds to a year-over-year rate of 3.37% (vs. 3.4% consensus).
An Update on the House Price Battle Royale: Low Inventory vs Affordability
by Calculated Risk on 4/09/2024 11:16:00 AM
Today, in the Calculated Risk Real Estate Newsletter: An Update on the House Price Battle Royale: Low Inventory vs Affordability
A brief excerpt:
Almost a year ago I wrote: House Price Battle Royale: Low Inventory vs Affordability. Here is an update as the battle continues!There is much more in the article.
I’ve been wrestling with the impact on house prices of the rapid increase in mortgage rates and monthly payments over the last two years. My reaction was the current situation was somewhat similar to the 1978 to 1982 period and we would likely see prices decline in real terms (adjusted for inflation). See from March 2022: Housing: Don't Compare the Current Housing Boom to the Bubble and Bust.
In that article I wrote on prices:[W]e should expect something similar to the what happened in the late ‘70s - a decline in real house prices seems likely … Currently we just have to watch and wait. However, we can be fairly confident that we won’t see cascading nominal price declines like during the housing bust - since there will be few distressed sales.In the 1980 period, nominal prices only declined slightly on a month-to-month basis a few times according to the Case-Shiller National house price index. However, real prices - adjusted for inflation - declined 10.7% from the peak. The inflation adjusted peak was in October 1979, and real prices didn’t exceed that peak until May 1986 (See from October 2022: House Prices: 7 Years in Purgatory).
Moody's: Retail Vacancy Rate Unchanged in Q1
by Calculated Risk on 4/09/2024 08:31:00 AM
Note: I covered apartments and offices in the newsletter: Moody's: Apartment Vacancy Rate Unchanged in Q1; Office Vacancy Rate at Record High
From Moody’s Analytics economists: Apartment and Retail in Holding Pattern, Office Evolution and Stress Continued, And Industrial Fundamentals Leveled Off
Q1 2024 data revealed trends similar to those observed in 2023, with retail vacancy rate remaining stable at 10.3%. Asking rents rose slightly by 0.2% to $21.69 per sqft, while effective rents also enjoyed 0.2% increase to $18.98 per sqft. During the holiday season, consumer activity was robust but as expected, decelerated in January as retailers reduced their expenditures at the start of the year. However, February marked a resurgence in consumer spending, with retail sales climbing by 0.6%. It is anticipated that overall retail sales in 2024 will mirror those of 2023, albeit with a larger share attributed to non-store and online transactions. The quarter also saw the addition of 198,000 square feet in new retail construction. Despite this growth, the retail sector continues to confront familiar financing obstacles due to persistent high interest rates, suggesting little change in this trend for the remainder of the year. Although bankruptcy announcements have been prevalent, the vacancy rate has remained steady. This stability is partly due to new, smaller store openings by entities that normally wouldn’t fill this space, such as Macy's and Toys R Us.
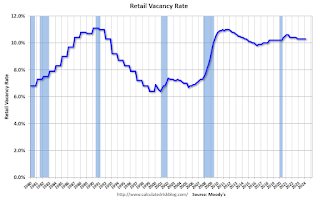 This graph shows the strip mall vacancy rate starting in 1980 (prior to 2000 the data is annual).
 In the mid-'00s, mall investment picked up as mall builders followed the "roof tops" of the residential boom (more loose lending). This led to the vacancy rate moving higher even before the recession started. Then there was a sharp increase in the vacancy rate during the recession and financial crisis.
Monday, April 08, 2024
Tuesday: Small Business Survey
by Calculated Risk on 4/08/2024 07:08:00 PM
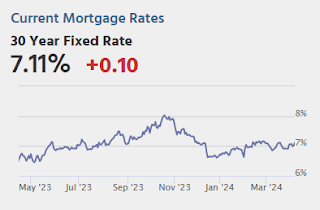
Mortgage rates moved up somewhat abruptly today as the bond market lost more ground over the weekend ... there weren't any compelling news headlines or economic reports driving the weakness. It would be better thought of as a hangover from Friday's jobs report.Tuesday:
As the week progresses, there will certainly be at least one major economic report with a proven track record of causing big reactions in rates: the Consumer Price Index (CPI) on Wednesday morning. With the average lender already near the highest levels since February, a bad reaction to CPI could easily launch rates back to levels not seen since November. On the other hand, if CPI manages to come in much lower than expected, rates would almost certainly drop. [30 year fixed 7.11%]
emphasis added
• At 6:00 AM ET, NFIB Small Business Optimism Index for March.
Hotels: Occupancy Rate Decreased 5.6% Year-over-year Due to Easter Holiday
by Calculated Risk on 4/08/2024 02:59:00 PM
As expected ahead of the Easter holiday, U.S. hotel performance decreased from the previous week, according to CoStar’s latest data through 30 March.The following graph shows the seasonal pattern for the hotel occupancy rate using the four-week average.
24-30 March 2024 (percentage change from comparable week in 2023):
• Occupancy: 62.3% (-5.6%)
• Average daily rate (ADR): US$157.14 (-0.7%
• Revenue per available room (RevPAR): US$97.83 (-6.3%)
emphasis added
 Click on graph for larger image.
The red line is for 2024, black is 2020, blue is the median, and dashed light blue is for 2023. Dashed purple is for 2018, the record year for hotel occupancy.
1st Look at Local Housing Markets in March
by Calculated Risk on 4/08/2024 01:04:00 PM
Today, in the Calculated Risk Real Estate Newsletter: 1st Look at Local Housing Markets in March
A brief excerpt:
NOTE: The tables for active listings, new listings and closed sales all include a comparison to March 2019 for each local market (some 2019 data is not available).There is much more in the article.
This is the first look at several early reporting local markets in March. I’m tracking about 40 local housing markets in the US. Some of the 40 markets are states, and some are metropolitan areas. I’ll update these tables throughout the month as additional data is released.
Closed sales in March were mostly for contracts signed in January and February when 30-year mortgage rates averaged 6.44% and 6.78%, respectively. This is down from the 7%+ mortgage rates in the August through November period (although rates are now back in the 7% range again).
...
In March, sales in these markets were down 8.9% YoY. In February, these same markets were up 2.3% year-over-year Not Seasonally Adjusted (NSA).
Sales in all of these markets are down compared to January 2019.
...
This is a year-over-year decrease NSA for these early reporting markets. However, there were two fewer working days in March 2024 compared to March 2023, so sales Seasonally Adjusted will be higher year-over-year than Not Seasonally Adjusted sales.
...
This was just a few early reporting markets. Many more local markets to come!
Leading Index for Commercial Real Estate Decreased 9% in March
by Calculated Risk on 4/08/2024 11:01:00 AM
From Dodge Data Analytics: Dodge Momentum Index Fell 9% in March
The Dodge Momentum Index (DMI), issued by Dodge Construction Network, fell 8.6% in March to 164.0 (2000=100) from the revised February reading of 179.5. Over the month, commercial planning fell 3.2% and institutional planning dropped 17.2%.
“In 2023, commercial planning decreased while institutional planning notably improved, sitting 29% above year-ago levels in February 2024. While strong market fundamentals should support institutional planning this year, this side of the Index is more at risk for a substantive correction after last year’s growth,” stated Sarah Martin, associate director of forecasting for Dodge Construction Network. “Much of the decline on the institutional side is credited to lower levels of education planning. Between February 2023 and February 2024, life science and R&D laboratory projects account for roughly 34% of education planning value, with that share reaching 59% in some months. In March, however, that share dropped to 7%. The surge of lab construction in recent years may lead to decreased planning demand as the market absorbs new supply in 2024. Likely, lower lab volumes will result in education planning returning to its long-run, and more sustainable, average.”
...
The DMI is a monthly measure of the value of nonresidential building projects going into planning, shown to lead construction spending for nonresidential buildings by a full year.
emphasis added
 Click on graph for larger image.
This graph shows the Dodge Momentum Index since 2002. The index was at 164.0 in March, down from 179.5 the previous month.
According to Dodge, this index leads "construction spending for nonresidential buildings by a full year". This index suggests a slowdown in 2024.
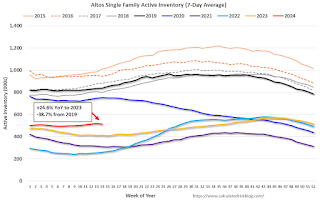
Housing April 8th Weekly Update: Inventory down 0.9% Week-over-week due to Easter Holiday, Up 24.6% Year-over-year
by Calculated Risk on 4/08/2024 08:12:00 AM
 Click on graph for larger image.
This inventory graph is courtesy of Altos Research.
