by Calculated Risk on 4/26/2024 07:12:00 PM
Friday, April 26, 2024
April 26th COVID Update: Hospitalizations at Pandemic Low!

| COVID Metrics | ||||
|---|---|---|---|---|
| Now | Week Ago | Goal | ||
| Hospitalized2 | 5,195 | 6,055 | ≤3,0001 | |
| Deaths per Week2 | 648 | 806 | ≤3501 | |
| 1my goals to stop weekly posts, 2Weekly for Currently Hospitalized, and Deaths 🚩 Increasing number weekly for Hospitalized and Deaths ✅ Goal met. | ||||
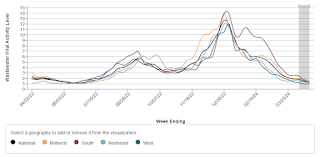
 Click on graph for larger image.
This graph shows the weekly (columns) number of deaths reported.
 This appears to be a leading indicator for COVID hospitalizations and deaths.
Las Vegas March 2024: Visitor Traffic Up 0.4% YoY; Convention Traffic Down 37%
by Calculated Risk on 4/26/2024 03:53:00 PM
From the Las Vegas Visitor Authority: March 2024 Las Vegas Visitor Statistics
Benefitting from a mix of headliners and events from NASCAR to Madonna to several college basketball tournaments, Las Vegas visitation neared 3.7M in March 2024, up +0.4% YoY and nearly matching Mar 2019.
With a tough comparison to record‐breaking convention attendance last March when the destination hosted the triennial CONEXPO‐CON/AGG tradeshow (142,000), convention attendance this March saw a ‐37.2% YoY decrease.
Overall hotel occupancy reached 85.3% for the month (‐3.0 pts YoY). After breaking the record for both ADR and RevPAR last March, ADR and RevPAR saw a decrease of ‐16.4% and ‐19.2% respectively.
emphasis added
 Click on graph for larger image.
 The first graph shows visitor traffic for 2019 (Black), 2020 (dark blue), 2021 (light blue), 2022 (light orange), 2023 (dark orange) and 2024 (red).
Visitor traffic was up 0.4% compared to last March. Visitor traffic was down 0.7% compared to the same month in 2019.
Fannie and Freddie: Single Family Serious Delinquency Rate Decreased, Multi-family Decreased in March
by Calculated Risk on 4/26/2024 12:53:00 PM
Today, in the Calculated Risk Real Estate Newsletter: Fannie and Freddie: Single Family Serious Delinquency Rate Decreased, Multi-family Decreased in March
Brief excerpt:
Single-family serious delinquencies decreased in March, and multi-family serious delinquencies decreased again after the huge surge in January.
...
Freddie Mac reports that the multi-family delinquencies rate declined to 0.34% in March, down from 0.35% in February, and down from 0.44% in January.
This graph shows the Freddie multi-family serious delinquency rate since 2012. Rates were still high in 2012 following the housing bust and financial crisis.
The multi-family rate increased following the pandemic and has increased recently as rent growth has slowed, vacancy rates have increased, and borrowing rates have increased sharply. The rate surged higher in January but declined in February and March - but is still at a high level. This will be something to watch as more apartments come on the market.
PCE Measure of Shelter Slows Slightly to 5.8% YoY in March
by Calculated Risk on 4/26/2024 08:57:00 AM
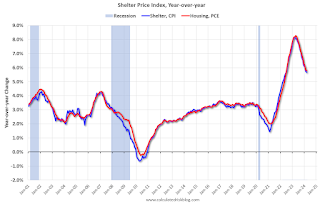
Here is a graph of the year-over-year change in shelter from the CPI report and housing from the PCE report this morning, both through March 2024.

Since asking rents are mostly flat year-over-year, these measures will continue to slow over the next year.
The second graph shows PCE prices, Core PCE prices and Core ex-housing over the last 6 months (annualized):
 Key measures are slightly above the Fed's target on a 6-month basis.
PCE Price Index: 2.5% (6 month annualized)
Core PCE Prices: 3.0%
Core minus Housing: 2.4%
Personal Income increased 0.5% in March; Spending increased 0.8%
by Calculated Risk on 4/26/2024 08:30:00 AM
The BEA released the Personal Income and Outlays report for March:
Personal income increased $122.0 billion (0.5 percent at a monthly rate) in March, according to estimates released today by the Bureau of Economic Analysis. Disposable personal income (DPI), personal income less personal current taxes, increased $104.0 billion (0.5 percent) and personal consumption expenditures (PCE) increased $160.9 billion (0.8 percent).The March PCE price index increased 2.7 percent year-over-year (YoY), up from 2.5 percent YoY in February, and down from the recent peak of 7.0 percent in June 2022.
The PCE price index increased 0.3 percent. Excluding food and energy, the PCE price index increased 0.3 percent. Real DPI increased 0.2 percent in March and real PCE increased 0.5 percent; goods increased 1.1 percent and services increased 0.2 percent.
emphasis added
The following graph shows real Personal Consumption Expenditures (PCE) through March 2024 (2017 dollars). Note that the y-axis doesn't start at zero to better show the change.
 Click on graph for larger image.
The dashed red lines are the quarterly levels for real PCE.
Personal income was at expectations, and PCE was well above expectations.
Thursday, April 25, 2024
Friday: Personal Income and Outlays
by Calculated Risk on 4/25/2024 08:01:00 PM

Friday:
• At 8:30 AM ET, Personal Income and Outlays, March 2024. The consensus is for a 0.5% increase in personal income, and for a 0.3% increase in personal spending. And for the Core PCE price index to increase 0.3%. PCE prices are expected to be up 2.6% YoY, and core PCE prices up 2.7% YoY.
• At 10:00 AM: University of Michigan's Consumer sentiment index (Final for April). The consensus is for a reading of 77.9.
Lawler: Observations on the Recent Surge in Net International Migration
by Calculated Risk on 4/25/2024 02:33:00 PM
Today, in the Calculated Risk Real Estate Newsletter: Lawler: Observations on the Recent Surge in Net International Migration
A brief excerpt:
NOTE: Housing economist Tom Lawler has written extensively on demographics and the impact on household growth and housing demand. Last November, Lawler reviewed the most recent Census projections: Lawler on Existing Home Sales, Population Projections and Household Slowdown. Today he discusses the recent surge in Net International Migration.There is much more in the article.
From Tom Lawler:
One of the biggest demographic stories of the past two years has been the recent surge in net international migration (NIM). While this surge is not reflected in the latest Census Bureau’s “official” population estimates and one-year-ahead forecasts (so-called “Vintage 2023), that is because these estimates did not account for the rapid increase in “unauthorized” immigration over the past two years.
Estimates of NIM over the past few years vary considerably. For example, in its January 2024 demographic forecast update the CBO estimated that NIM was 3.267 million in 2023, up from 2.674 million in 2022 and 1.171 million in 2021. (These are calendar-year estimates). This contrasts markedly with Census’ Vintage 2023 NIM estimates of 1.139 million in the 12 months ending June 2023, 999 thousand in the 12 months ending June 2022, and 376 thousand in the 12 months ending June 2021.
Goldman Sachs, also incorporating data on unauthorized immigration, estimates that NIM in 2023 was 2.5 million, a bit below the CBO estimate but well above official Census estimates from the Population Division.
U.S. Births decreased in 2023
by Calculated Risk on 4/25/2024 01:01:00 PM
From the National Center for Health Statistics: Births: Provisional Data for 2023. The NCHS reports:
The provisional number of births for the United States in 2023 was 3,591,328, down 2% from 2022. The general fertility rate was 54.4 births per 1,000 females ages 15–44, down 3% from 2022. The total fertility rate was 1,616.5 births per 1,000 women in 2023, a decline of 2% from 2022. Birth rates declined for females in age groups 15–19 through 35–39 and were unchanged for females ages 10–14 and for women ages 40–44 and 45–49 in 2023. The birth rate for teenagers ages 15–19 declined by 3% in 2023 to 13.2 births per 1,000 females; the rate for younger teenagers (ages 15–17) was unchanged, and the rate for older teenagers (ages 18–19) declined 3%. THere is a long-term graph of annual U.S. births through 2023.
emphasis added
report.
 Click on graph for larger image.
Births peaked in 2007 and have generally declined since then.
Note the amazing decline in teenage births.
There is much more in the report.
NAR: Pending Home Sales Increase 3.4% in March; Up 0.1% Year-over-year
by Calculated Risk on 4/25/2024 10:00:00 AM
From the NAR: Pending Home Sales Ascended 3.4% in March
Pending home sales in March climbed 3.4%, according to the National Association of REALTORS®. The Northeast, South and West posted monthly gains in transactions while the Midwest recorded a loss. Year-over-year, the Northeast and South registered decreases but the Midwest and West improved.This was well above expectations. Note: Contract signings usually lead sales by about 45 to 60 days, so this would usually be for closed sales in April and May.
The Pending Home Sales Index (PHSI)* – a forward-looking indicator of home sales based on contract signings – increased to 78.2 in March. Year over year, pending transactions were up 0.1%. An index of 100 is equal to the level of contract activity in 2001.
...
The Northeast PHSI increased 2.7% from last month to 65.1, a decline of 0.3% from March 2023. The Midwest index fell 4.3% to 78.1 in March, up 1.3% from one year ago.
The South PHSI improved 7.0% to 95.8 in March, dropping 1.5% from the prior year. The West index rose 6.8% in March to 61.0, up 3.6% from March 2023.
emphasis added
BEA: Real GDP increased at 1.6% Annualized Rate in Q1
by Calculated Risk on 4/25/2024 08:38:00 AM
From the BEA: Gross Domestic Product, First Quarter 2024 (Advance Estimate)
Real gross domestic product (GDP) increased at an annual rate of 1.6 percent in the first quarter of 2024, according to the "advance" estimate released by the Bureau of Economic Analysis. In the fourth quarter of 2023, real GDP increased 3.4 percent.PCE increased at a 2.5% annual rate, and residential investment increased at a 13.9% rate. The advance Q1 GDP report, with 1.6% annualized increase, was well below expectations.
The increase in real GDP primarily reflected increases in consumer spending, residential fixed investment, nonresidential fixed investment, and state and local government spending that were partly offset by a decrease in private inventory investment. Imports, which are a subtraction in the calculation of GDP, increased.
The increase in consumer spending reflected an increase in services that was partly offset by a decrease in goods. Within services, the increase primarily reflected increases in health care as well as financial services and insurance. Within goods, the decrease primarily reflected decreases in motor vehicles and parts as well as gasoline and other energy goods. Within residential fixed investment, the increase was led by brokers’ commissions and other ownership transfer costs as well as new single-family housing construction. The increase in nonresidential fixed investment mainly reflected an increase in intellectual property products. The increase in state and local government spending reflected an increase in compensation of state and local government employees. The decrease in inventory investment primarily reflected decreases in wholesale trade and manufacturing. Within imports, the increase reflected increases in both goods and services.
Compared to the fourth quarter, the deceleration in real GDP in the first quarter primarily reflected decelerations in consumer spending, exports, and state and local government spending and a downturn in federal government spending. These movements were partly offset by an acceleration in residential fixed investment. Imports accelerated.
emphasis added
Last 10 Posts
In Memoriam: Doris "Tanta" Dungey
Archive
Econbrowser
Pettis: China Financial Markets
NY Times Upshot
The Big Picture
| Privacy Policy |
| Copyright © 2007 - 2025 CR4RE LLC |
| Excerpts NOT allowed on x.com |


