 RSS Feed
 by Calculated Risk on 5/04/2024 02:11:00 PM
Saturday, May 04, 2024
Real Estate Newsletter Articles this Week: National House Price Index Up 6.4% year-over-year in February
At the Calculated Risk Real Estate Newsletter this week:
• Case-Shiller: National House Price Index Up 6.4% year-over-year in February
• Inflation Adjusted House Prices 2.4% Below Peak
• Lawler: Update on Mortgage Rates and Spreads and also New / Renewal Rents
• Freddie Mac House Price Index Increased in March; Up 6.6% Year-over-year
This is usually published 4 to 6 times a week and provides more in-depth analysis of the housing market.
Schedule for Week of May 5, 2024
by Calculated Risk on 5/04/2024 08:11:00 AM
This will be a very light week for economic data.
2:00 PM: Senior Loan Officer Opinion Survey on Bank Lending Practices for April.
No major economic releases scheduled.
7:00 AM ET: The Mortgage Bankers Association (MBA) will release the results for the mortgage purchase applications index.
8:30 AM: The initial weekly unemployment claims report will be released. The consensus is for 206 thousand initial claims, down from 208 thousand last week.
10:00 AM: University of Michigan's Consumer sentiment index (Preliminary for May).
Friday, May 03, 2024
May 3rd COVID Update: Deaths Continue to Decline
by Calculated Risk on 5/03/2024 07:11:00 PM
 Note: Mortgage rates are from MortgageNewsDaily.com and are for top tier scenarios.
It is likely that we will see pandemic lows for weekly deaths in the next couple of weeks. That is welcome news!
For deaths, I'm currently using 4 weeks ago for "now", since the most recent three weeks will be revised significantly.
Note: "Effective May 1, 2024, hospitals are no longer required to report COVID-19 hospital admissions, hospital capacity, or hospital occupancy data." So I'm no longer tracking hospitalizations, however hospitalizations were at a pandemic low last week.
| COVID Metrics | ||||
|---|---|---|---|---|
| Now | Week Ago | Goal | ||
| Deaths per Week | 573 | 678 | ≤3501 | |
| 1my goals to stop weekly posts, 🚩 Increasing number weekly for Deaths ✅ Goal met. | ||||
 Click on graph for larger image.
This graph shows the weekly (columns) number of deaths reported.
Weekly deaths have declined sharply from the recent peak of 2,561 but are still 17% above the pandemic low of 491 last July.
 This appears to be a leading indicator for COVID hospitalizations and deaths.
Nationally, COVID in wastewater is now off more than 90% from the holiday peak at the end of December, and that suggests weekly deaths will continue to decline.
Q2 GDP Tracking: Solid Early Look
by Calculated Risk on 5/03/2024 03:21:00 PM
From Goldman:
We lowered our Q2 GDP tracking estimate by 0.1pp to +3.3% (qoq ar) and our domestic final sales estimate by the same amount to +2.7% (qoq ar). [May 2nd estimate]And from the Altanta Fed: GDPNow
emphasis added
The GDPNow model estimate for real GDP growth (seasonally adjusted annual rate) in the second quarter of 2024 is 3.3 percent on May 2, unchanged from May 1 after rounding. [May 2nd estimate]
Inflation Adjusted House Prices 2.4% Below Peak; Price-to-rent index is 7.5% below 2022 peak
by Calculated Risk on 5/03/2024 12:24:00 PM
Today, in the Calculated Risk Real Estate Newsletter: Inflation Adjusted House Prices 2.4% Below Peak
Excerpt:
It has been over 17 years since the bubble peak. In the February Case-Shiller house price index released on Tuesday, the seasonally adjusted National Index (SA), was reported as being 71% above the bubble peak in 2006. However, in real terms, the National index (SA) is about 10% above the bubble peak (and historically there has been an upward slope to real house prices). The composite 20, in real terms, is 1% above the bubble peak.
People usually graph nominal house prices, but it is also important to look at prices in real terms. As an example, if a house price was $300,000 in January 2010, the price would be $429,000 today adjusted for inflation (43% increase). That is why the second graph below is important - this shows "real" prices.
The third graph shows the price-to-rent ratio, and the fourth graph is the affordability index. The last graph shows the 5-year real return based on the Case-Shiller National Index
...
The second graph shows the same two indexes in real terms (adjusted for inflation using CPI).
In real terms (using CPI), the National index is 2.4% below the recent peak, and the Composite 20 index is 3.1% below the recent peak in 2022. Both indexes were mostly flat in February in real terms.
In real terms, national house prices are 10.2% above the bubble peak levels. There is an upward slope to real house prices, and it has been over 17 years since the previous peak, but real prices are historically high.

There is much more in the article.
Comments on April Employment Report
by Calculated Risk on 5/03/2024 09:04:00 AM
The headline jobs number in the April employment report was below expectations, and February and March payrolls were revised down by 22,000 combined. The employment population ratio decreased, and the unemployment rate increased to 3.9%.
Construction employment increased 9 thousand and is now 604 thousand above the pre-pandemic level.
Manufacturing employment increased 8 thousand and is now 181 thousand above the pre-pandemic level.
Prime (25 to 54 Years Old) Participation
 Since the overall participation rate is impacted by both cyclical (recession) and demographic (aging population, younger people staying in school) reasons, here is the employment-population ratio for the key working age group: 25 to 54 years old.
The 25 to 54 years old participation rate increased in April to 83.5% from 83.4% in March, and the 25 to 54 employment population ratio increased to 80.8% from 80.7% the previous month.
Both are above pre-pandemic levels.
Average Hourly Wages
 The graph shows the nominal year-over-year change in "Average Hourly Earnings" for all private employees from the Current Employment Statistics (CES).
Average Hourly Wages
 The graph shows the nominal year-over-year change in "Average Hourly Earnings" for all private employees from the Current Employment Statistics (CES).
 There was a huge increase at the beginning of the pandemic as lower paid employees were let go, and then the pandemic related spike reversed a year later.
Wage growth has trended down after peaking at 5.9% YoY in March 2022 and was at 3.9% YoY in April.
Wage growth has trended down after peaking at 5.9% YoY in March 2022 and was at 3.9% YoY in April.
Part Time for Economic Reasons
 From the BLS report:
"The number of people employed part time for economic reasons, at 4.5 million, changed little in April. These individuals, who would have preferred full-time employment, were working part time because their hours had been reduced or they were unable to find full-time jobs."The number of persons working part time for economic reasons increased in April to 4.47 million from 4.31 million in March. This is slightly above pre-pandemic levels.
These workers are included in the alternate measure of labor underutilization (U-6) that increased to 7.4% from 7.3% in the previous month. This is down from the record high in April 2020 of 23.0% and up from the lowest level on record (seasonally adjusted) in December 2022 (6.5%). (This series started in 1994). This measure is above the 7.0% level in February 2020 (pre-pandemic).
Unemployed over 26 Weeks
 This graph shows the number of workers unemployed for 27 weeks or more.
 According to the BLS, there are 1.250 million workers who have been unemployed for more than 26 weeks and still want a job, up from 1.246 million the previous month.
This is down from post-pandemic high of 4.174 million, and up from the recent low of 1.050 million.
This is close to pre-pandemic levels.
Job Streak
Summary:
The headline jobs number in the April employment report was below expectations, and February and March payrolls were revised down by 22,000 combined. The employment population ratio decreased, and the unemployment rate increased to 3.9%. A solid report.
This is close to pre-pandemic levels.
Job Streak
Through April 2024, the employment report indicated positive job growth for 40 consecutive months, putting the current streak in 5th place of the longest job streaks in US history (since 1939).
| Headline Jobs, Top 10 Streaks | ||
|---|---|---|
| Year Ended | Streak, Months | |
| 1 | 2019 | 100 |
| 2 | 1990 | 48 |
| 3 | 2007 | 46 |
| 4 | 1979 | 45 |
| 5 | 20241 | 40 |
| 6 tie | 1943 | 33 |
| 6 tie | 1986 | 33 |
| 6 tie | 2000 | 33 |
| 9 | 1967 | 29 |
| 10 | 1995 | 25 |
| 1Currrent Streak | ||
Summary:
The headline jobs number in the April employment report was below expectations, and February and March payrolls were revised down by 22,000 combined. The employment population ratio decreased, and the unemployment rate increased to 3.9%. A solid report.
April Employment Report: 175 thousand Jobs, 3.9% Unemployment Rate
by Calculated Risk on 5/03/2024 08:30:00 AM
From the BLS:
Total nonfarm payroll employment increased by 175,000 in April, and the unemployment rate changed little at 3.9 percent, the U.S. Bureau of Labor Statistics reported today. Job gains occurred in health care, in social assistance, and in transportation and warehousing.
...
The change in total nonfarm payroll employment for February was revised down by 34,000, from +270,000 to +236,000, and the change for March was revised up by 12,000, from +303,000 to +315,000. With these revisions, employment in February and March combined is 22,000 lower than previously reported.
emphasis added
 Click on graph for larger image.
The first graph shows the jobs added per month since January 2021.
Total payrolls increased by 175 thousand in April. Private payrolls increased by 167 thousand, and public payrolls increased 8 thousand.
Payrolls for February and March were revised down 22 thousand, combined.
Payrolls for February and March were revised down 22 thousand, combined.
 The second graph shows the year-over-year change in total non-farm employment since 1968.
In April, the year-over-year change was 2.80 million jobs. Employment was up solidly year-over-year.
The third graph shows the employment population ratio and the participation rate.
 The Labor Force Participation Rate was unchanged at 62.7% in April, from 62.7% in March. This is the percentage of the working age population in the labor force.
 The Employment-Population ratio decreased to 60.2% from 60.3% (blue line).
I'll post the 25 to 54 age group employment-population ratio graph later.
 The fourth graph shows the unemployment rate.
 The unemployment rate increased to 3.9% in April from 3.8% in March.
This was below consensus expectations; and February and March payrolls were revised dpwn by 22,000 combined.
Thursday, May 02, 2024
Friday: Employment Report
by Calculated Risk on 5/02/2024 08:16:00 PM
 Note: Mortgage rates are from MortgageNewsDaily.com and are for top tier scenarios.
Friday:
• At 8:30 AM ET, Employment Report for April. The consensus is for 210,000 jobs added, and for the unemployment rate to be unchanged at 3.8%.
• At 10:00 AM, the ISM Services Index for April. The consensus is for a reading of 52.0, up from 51.4.
April Employment Preview
by Calculated Risk on 5/02/2024 02:57:00 PM
On Friday at 8:30 AM ET, the BLS will release the employment report for April. The consensus is for 210,000 jobs added, and for the unemployment rate to be unchanged at 3.8%.
There were 303,000 jobs added in March, and the unemployment rate was at 3.8%.
From Goldman Sachs economist Spencer Hill
We estimate nonfarm payrolls rose by 275k in April ... Our forecast reflects a favorable evolution in the April seasonal factors and a continued boost from above-normal immigration. ... We estimate that the unemployment rate edged down but was unchanged on a rounded basis at 3.8%From BofA:
emphasis added
We look for another month of solid job gains in the April employment report this week. We expect nonfarm payrolls to rise by 250k on the month, with private sector job gains totaling 200k. Elsewhere, we expect the unemployment rate, weekly hours, and the participation rate to hold steady at 3.8%, 34.4, and 62.7%, respectively.• ADP Report: The ADP employment report showed 192,000 private sector jobs were added in April. This was above consensus forecasts and suggests job gains slightly above consensus expectations, however, in general, ADP hasn't been very useful in forecasting the BLS report.
• ISM Surveys: Note that the ISM indexes are diffusion indexes based on the number of firms hiring (not the number of hires). The ISM® manufacturing employment index increased to 48.6%, up from 47.4% the previous month. This would suggest about 20,000 jobs lost in manufacturing. The ADP report indicated 9,000 manufacturing jobs added in April.
The ISM® services employment index will be released tomorrow.
• Unemployment Claims: The weekly claims report showed the same number of initial unemployment claims during the reference week from 212,000 in March to 212,000 in April. This suggests a similar number of layoffs in April compared to March.
• COVID: As far as the pandemic, the number of patients hospitalized during the reference week in April was around 6,000, down from 10,000 in March.
• Conclusion: My guess is employment gains will be above consensus expectations.
Realtor.com Reports Active Inventory Up 33.3% YoY; New Listings Up 10.4% YoY
by Calculated Risk on 5/02/2024 12:54:00 PM
What this means: On a weekly basis, Realtor.com reports the year-over-year change in active inventory and new listings. On a monthly basis, they report total inventory. For April, Realtor.com reported inventory was up 30.4% YoY, but still down almost 36% compared to April 2017 to 2019 levels.
Now - on a weekly basis - inventory is up 33.3% YoY.
Realtor.com has monthly and weekly data on the existing home market. Here is their weekly report: Weekly Housing Trends View—Data Week Ending April 27, 2024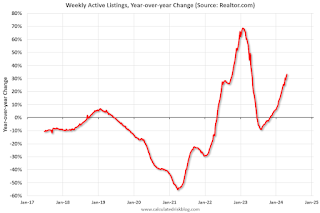 Here is a graph of the year-over-year change in inventory according to realtor.com.
Inventory was up year-over-year for the 25th consecutive week.
Realtor.com has monthly and weekly data on the existing home market. Here is their weekly report: Weekly Housing Trends View—Data Week Ending April 27, 2024
• Active inventory increased, with for-sale homes 33.3% above year-ago levels.
For the 25th straight week, there were more homes listed for sale versus the prior year, giving homebuyers more options. As mortgage rates have climbed to new 2024 highs, we could see sellers adjust their plans, since nearly three-quarters of potential sellers also plan to buy a home.
• New listings–a measure of sellers putting homes up for sale–were up this week, by 10.4% from one year ago.
Since February, the number of homes newly listed for sale has surpassed year ago pace by double-digit with the exception of a few weeks around this year’s spring holidays. As reported in the Realtor.com April housing report, newly listed homes trailed behind every prior year except for the pandemic-induced starting point of 2020 and the record low of 2023.
 Here is a graph of the year-over-year change in inventory according to realtor.com.
 Inventory was up year-over-year for the 25th consecutive week.
However, inventory is still historically very low.
New listings remain below typical pre-pandemic levels although increasing.


