by Calculated Risk on 5/06/2024 08:11:00 AM
Monday, May 06, 2024
Housing May 6th Weekly Update: Inventory up 0.6% Week-over-week, Up 33.1% Year-over-year
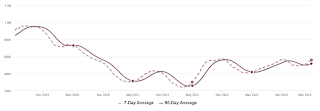 Click on graph for larger image.
This inventory graph is courtesy of Altos Research.

Sunday, May 05, 2024
Sunday Night Futures
by Calculated Risk on 5/05/2024 06:50:00 PM
Weekend:
• Schedule for Week of May 5, 2024
Monday:
• At 2:00 PM ET, Senior Loan Officer Opinion Survey on Bank Lending Practices for April.
From CNBC: Pre-Market Data and Bloomberg futures S&P 500 are up 10 and DOW futures are up 80 (fair value).
Oil prices were up over the last week with WTI futures at $78.11 per barrel and Brent at $82.96 per barrel. A year ago, WTI was at $71, and Brent was at $76 - so WTI oil prices are up about 10% year-over-year.
Here is a graph from Gasbuddy.com for nationwide gasoline prices. Nationally prices are at $3.62 per gallon. A year ago, prices were at $3.52 per gallon, so gasoline prices are up $0.10 year-over-year.
Hotels: Occupancy Rate decreased 1.2% Year-over-year
by Calculated Risk on 5/05/2024 08:21:00 AM
As expected with Passover, U.S. hotel performance came in lower than the previous week and comparable period last year, according to CoStar’s latest data through 27 April. ...The following graph shows the seasonal pattern for the hotel occupancy rate using the four-week average.
21-27 April 2024 (percentage change from comparable week in 2023):
• Occupancy: 65.7% (-1.2%)
• Average daily rate (ADR): US$154.44 (-1.3%)
• Revenue per available room (RevPAR): US$101.42 (-2.5%)
emphasis added
 Click on graph for larger image.
The red line is for 2024, black is 2020, blue is the median, and dashed light blue is for 2023. Dashed purple is for 2018, the record year for hotel occupancy.
Saturday, May 04, 2024
Real Estate Newsletter Articles this Week: National House Price Index Up 6.4% year-over-year in February
by Calculated Risk on 5/04/2024 02:11:00 PM
At the Calculated Risk Real Estate Newsletter this week:
• Case-Shiller: National House Price Index Up 6.4% year-over-year in February
• Inflation Adjusted House Prices 2.4% Below Peak
• Lawler: Update on Mortgage Rates and Spreads and also New / Renewal Rents
• Freddie Mac House Price Index Increased in March; Up 6.6% Year-over-year
This is usually published 4 to 6 times a week and provides more in-depth analysis of the housing market.
Schedule for Week of May 5, 2024
by Calculated Risk on 5/04/2024 08:11:00 AM
This will be a very light week for economic data.
2:00 PM: Senior Loan Officer Opinion Survey on Bank Lending Practices for April.
No major economic releases scheduled.
7:00 AM ET: The Mortgage Bankers Association (MBA) will release the results for the mortgage purchase applications index.
8:30 AM: The initial weekly unemployment claims report will be released. The consensus is for 206 thousand initial claims, down from 208 thousand last week.
10:00 AM: University of Michigan's Consumer sentiment index (Preliminary for May).
Friday, May 03, 2024
May 3rd COVID Update: Deaths Continue to Decline
by Calculated Risk on 5/03/2024 07:11:00 PM
| COVID Metrics | ||||
|---|---|---|---|---|
| Now | Week Ago | Goal | ||
| Deaths per Week | 573 | 678 | ≤3501 | |
| 1my goals to stop weekly posts, 🚩 Increasing number weekly for Deaths ✅ Goal met. | ||||
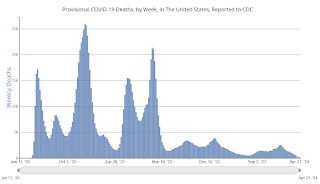 Click on graph for larger image.
This graph shows the weekly (columns) number of deaths reported.
 This appears to be a leading indicator for COVID hospitalizations and deaths.
Q2 GDP Tracking: Solid Early Look
by Calculated Risk on 5/03/2024 03:21:00 PM
From Goldman:
We lowered our Q2 GDP tracking estimate by 0.1pp to +3.3% (qoq ar) and our domestic final sales estimate by the same amount to +2.7% (qoq ar). [May 2nd estimate]And from the Altanta Fed: GDPNow
emphasis added
The GDPNow model estimate for real GDP growth (seasonally adjusted annual rate) in the second quarter of 2024 is 3.3 percent on May 2, unchanged from May 1 after rounding. [May 2nd estimate]
Inflation Adjusted House Prices 2.4% Below Peak; Price-to-rent index is 7.5% below 2022 peak
by Calculated Risk on 5/03/2024 12:24:00 PM
Today, in the Calculated Risk Real Estate Newsletter: Inflation Adjusted House Prices 2.4% Below Peak
Excerpt:
It has been over 17 years since the bubble peak. In the February Case-Shiller house price index released on Tuesday, the seasonally adjusted National Index (SA), was reported as being 71% above the bubble peak in 2006. However, in real terms, the National index (SA) is about 10% above the bubble peak (and historically there has been an upward slope to real house prices). The composite 20, in real terms, is 1% above the bubble peak.
People usually graph nominal house prices, but it is also important to look at prices in real terms. As an example, if a house price was $300,000 in January 2010, the price would be $429,000 today adjusted for inflation (43% increase). That is why the second graph below is important - this shows "real" prices.
The third graph shows the price-to-rent ratio, and the fourth graph is the affordability index. The last graph shows the 5-year real return based on the Case-Shiller National Index
...
The second graph shows the same two indexes in real terms (adjusted for inflation using CPI).
In real terms (using CPI), the National index is 2.4% below the recent peak, and the Composite 20 index is 3.1% below the recent peak in 2022. Both indexes were mostly flat in February in real terms.
In real terms, national house prices are 10.2% above the bubble peak levels. There is an upward slope to real house prices, and it has been over 17 years since the previous peak, but real prices are historically high.
Comments on April Employment Report
by Calculated Risk on 5/03/2024 09:04:00 AM
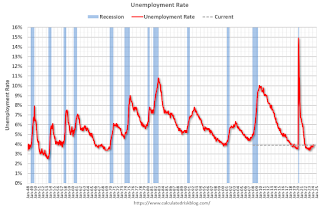
The headline jobs number in the April employment report was below expectations, and February and March payrolls were revised down by 22,000 combined. The employment population ratio decreased, and the unemployment rate increased to 3.9%.
Prime (25 to 54 Years Old) Participation
 Since the overall participation rate is impacted by both cyclical (recession) and demographic (aging population, younger people staying in school) reasons, here is the employment-population ratio for the key working age group: 25 to 54 years old.
The 25 to 54 years old participation rate increased in April to 83.5% from 83.4% in March, and the 25 to 54 employment population ratio increased to 80.8% from 80.7% the previous month.
Average Hourly Wages
 The graph shows the nominal year-over-year change in "Average Hourly Earnings" for all private employees from the Current Employment Statistics (CES).
 Wage growth has trended down after peaking at 5.9% YoY in March 2022 and was at 3.9% YoY in April.
Part Time for Economic Reasons
 From the BLS report:
"The number of people employed part time for economic reasons, at 4.5 million, changed little in April. These individuals, who would have preferred full-time employment, were working part time because their hours had been reduced or they were unable to find full-time jobs."The number of persons working part time for economic reasons increased in April to 4.47 million from 4.31 million in March. This is slightly above pre-pandemic levels.
These workers are included in the alternate measure of labor underutilization (U-6) that increased to 7.4% from 7.3% in the previous month. This is down from the record high in April 2020 of 23.0% and up from the lowest level on record (seasonally adjusted) in December 2022 (6.5%). (This series started in 1994). This measure is above the 7.0% level in February 2020 (pre-pandemic).
Unemployed over 26 Weeks
 This graph shows the number of workers unemployed for 27 weeks or more.
 According to the BLS, there are 1.250 million workers who have been unemployed for more than 26 weeks and still want a job, up from 1.246 million the previous month.
This is close to pre-pandemic levels.
Job Streak
| Headline Jobs, Top 10 Streaks | ||
|---|---|---|
| Year Ended | Streak, Months | |
| 1 | 2019 | 100 |
| 2 | 1990 | 48 |
| 3 | 2007 | 46 |
| 4 | 1979 | 45 |
| 5 | 20241 | 40 |
| 6 tie | 1943 | 33 |
| 6 tie | 1986 | 33 |
| 6 tie | 2000 | 33 |
| 9 | 1967 | 29 |
| 10 | 1995 | 25 |
| 1Currrent Streak | ||
Summary:
The headline jobs number in the April employment report was below expectations, and February and March payrolls were revised down by 22,000 combined. The employment population ratio decreased, and the unemployment rate increased to 3.9%. A solid report.
April Employment Report: 175 thousand Jobs, 3.9% Unemployment Rate
by Calculated Risk on 5/03/2024 08:30:00 AM
From the BLS:
Total nonfarm payroll employment increased by 175,000 in April, and the unemployment rate changed little at 3.9 percent, the U.S. Bureau of Labor Statistics reported today. Job gains occurred in health care, in social assistance, and in transportation and warehousing.
...
The change in total nonfarm payroll employment for February was revised down by 34,000, from +270,000 to +236,000, and the change for March was revised up by 12,000, from +303,000 to +315,000. With these revisions, employment in February and March combined is 22,000 lower than previously reported.
emphasis added
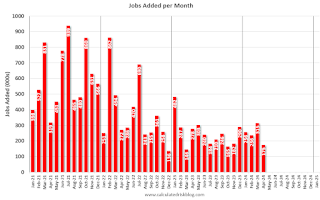 Click on graph for larger image.
The first graph shows the jobs added per month since January 2021.
Payrolls for February and March were revised down 22 thousand, combined.
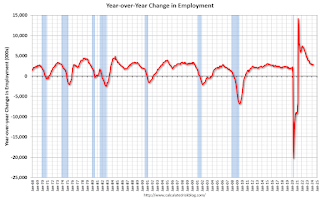 The second graph shows the year-over-year change in total non-farm employment since 1968.
In April, the year-over-year change was 2.80 million jobs. Employment was up solidly year-over-year.
The third graph shows the employment population ratio and the participation rate.
 The Labor Force Participation Rate was unchanged at 62.7% in April, from 62.7% in March. This is the percentage of the working age population in the labor force.
 The Employment-Population ratio decreased to 60.2% from 60.3% (blue line).I'll have more later ...

