 RSS Feed
 by Calculated Risk on 5/07/2024 08:00:00 AM
Tuesday, May 07, 2024
CoreLogic: US Home Prices Increased 5.3% Year-over-year in March
Notes: This CoreLogic House Price Index report is for March. The recent Case-Shiller index release was for February. The CoreLogic HPI is a three-month weighted average and is not seasonally adjusted (NSA).
From CoreLogic: Northeast Continues to Lead US for Annual Home Price Gains in March, CoreLogic Reports
• U.S. single-family home prices rose by 5.3% year over year in March, marking the 146th consecutive month of annual growth.This was a smaller YoY increase than the 5.5% reported for February, and the 5.8% YoY increase reported for January.
• Over the next 12 months, year-over-year home price gains are projected to range between 5.6% and 3.7%.
• Four of the top five states for annual appreciation in March are in the Northeast: New Jersey (12.2%), New Hampshire (10.6%), Connecticut (9.5%) and Rhode Island (9.2%).
...
U.S. year-over-year home price gains remained above 5% in March for the fifth straight month and are projected to stay in that general range for most of the next 12 months. Northeastern states continued to post the nation’s largest gains, as more Americans migrate to bedroom communities of major cities and job hubs, as well as areas where household incomes are relatively higher and can sustain the elevated cost of homeownership. In addition, the inventory gains seen in states like Florida and Texas still lag in the Northeast, a trend that continues to exacerbate supply-and-demand fundamentals and further adds to home price pressure in that region. Consequently, markets with larger additions of homes for sale are now experiencing slowing home price appreciation.
“Home prices increased again this March beyond the typical seasonal uptick, despite mortgage rates reaching this year’s high and the affordability crunch continuing to keep many prospective buyers on the sidelines,” said Dr. Selma Hepp, chief economist for CoreLogic. “Even with the long-anticipated break in for-sale inventory, the surging cost of homeownership, further fueled by rising insurance and tax expenses, is holding potential home sales back, as is evident in the slow rise in sales compared with last year. These price pressures reflect the overall supply-and-demand mismatch, as well as continued interest from households with larger budgets.”
emphasis added
Monday, May 06, 2024
Tuesday: CoreLogic Home Price Index
by Calculated Risk on 5/06/2024 07:45:00 PM
 From Matthew Graham at Mortgage News Daily: Everything is a Sideshow Until May 15th
In a world where all hope for interest rate relief hinges on disinflation, CPI dominates all other calendar events. With nearly 10 days to go until the next release (May 15th) and very little on the econ calendar between now and then, it would be a surprise to see any new directional trends emerge. [30 year fixed 7.25%]Tuesday:
emphasis added
• At 8:00 AM ET, CoreLogic Home Price Index for March
Fed SLOOS Survey: Banks reported Tighter Standards, Weaker Demand for almost All Loan Types
by Calculated Risk on 5/06/2024 02:49:00 PM
From the Federal Reserve: The April 2024 Senior Loan Officer Opinion Survey on Bank Lending Practices
The April 2024 Senior Loan Officer Opinion Survey on Bank Lending Practices (SLOOS) addressed changes in the standards and terms on, and demand for, bank loans to businesses and households over the past three months, which generally correspond to the first quarter of 2024.
Regarding loans to businesses, survey respondents reported, on balance, tighter standards and weaker demand for commercial and industrial (C&I) loans to firms of all sizes over the first quarter. Meanwhile, banks reported tighter standards and weaker demand for all commercial real estate (CRE) loan categories.
Banks also responded to a set of special questions about changes in lending policies and demand for CRE loans over the past year. For all CRE loan categories, banks reported having tightened all queried lending policies, including the spread of loan rates over the cost of funds, maximum loan sizes, loan-to-value ratios, debt service coverage ratios, and interest-only payment periods.
For loans to households, banks reported that lending standards tightened across some categories of residential real estate (RRE) loans while remaining unchanged for others on balance. Meanwhile, demand weakened for all RRE loan categories. In addition, banks reported tighter standards and weaker demand for home equity lines of credit (HELOCs). Moreover, for credit card, auto, and other consumer loans, standards reportedly tightened and demand weakened.
While banks, on balance, reported having tightened lending standards further for most loan categories in the first quarter, lower net shares of banks reported tightening lending standards than in the fourth quarter of last year across most loan categories.
emphasis added
 Click on graph for larger image.
This graph on Residential Real Estate demand is from the Senior Loan Officer Survey Charts.
This graph is for demand and shows that demand has declined.
The left graphs are from 1990 to 2014. The right graphs are from 2015 to Q1 2024.
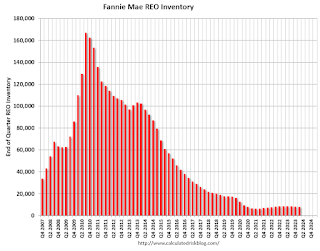
Fannie "Real Estate Owned" inventory Decreased in Q1 2024
by Calculated Risk on 5/06/2024 02:01:00 PM
Fannie reported results for Q1 2024. Here is some information on single-family Real Estate Owned (REOs).
Fannie Mae reported the number of REOs decreased to 7,791 at the end of Q1 2024, down 5% from 8,403 at the end of the previous quarter, and down 9% year-over-year from Q1 2023.
For Fannie, this is down 95% from the 166,787 peak number of REOs in Q3 2010.
 Click on graph for larger image.
Here is a graph of Fannie Real Estate Owned (REO).
This is well below the normal level of REOs for Fannie, and there will not be a huge wave of foreclosures.
 Click on graph for larger image.
Here is a graph of Fannie Real Estate Owned (REO).
This is well below the normal level of REOs for Fannie, and there will not be a huge wave of foreclosures.
ICE Mortgage Monitor: Annual home price growth eased in March; "For-sale inventory has been growing sharply across Florida"
by Calculated Risk on 5/06/2024 11:01:00 AM
Today, in the Real Estate Newsletter: ICE Mortgage Monitor: Annual home price growth eased in March
Brief excerpt:
Press Release: ICE Mortgage Monitor: Historically Strong Home Price Growth Pushes U.S. Mortgage Holders’ Tappable Equity to Record $11TThere is much more in the article.Here is the year-over-year in house prices according to the ICE Home Price Index (HPI). The ICE HPI is a repeat sales index. Black Knight reports the median price change of the repeat sales. The index was up 5.6% year-over-year in March, down from 6.0% YoY in February.
• Home price growth slowed in March, driven by a tightening of both mortgage rates and home affordability, but continues to remain historically strong
• Annual home price growth eased from an upwardly revised 6.0% in February to +5.6% in March, with prices rising by a seasonally adjusted +0.42% in the month, down from a revised +0.58% in February
• On a non-adjusted basis, prices were up +1.2% in March, more than 25% above the 25-year March average of +0.96%
• March marked the third straight month of above average monthly growth, after monthly gains fell below the 25-year average in five of the final six months of 2023, dampened by elevated interest rates
• While rising interest rates suppressed purchase demand and allowed modest inventory growth this spring, prices have remained resilient so far
• That said, adjusted monthly growth continuing at or near its currently rate would result in modestly slowing annual home price growth as we move into summer

Housing May 6th Weekly Update: Inventory up 0.6% Week-over-week, Up 33.1% Year-over-year
by Calculated Risk on 5/06/2024 08:11:00 AM
Altos reports that active single-family inventory was up 0.6% week-over-week. Inventory is now up 13.3% from the February bottom.
 Click on graph for larger image.
This inventory graph is courtesy of Altos Research.
As of May 3rd, inventory was at 560 thousand (7-day average), compared to 556 thousand the prior week.
Inventory is still far below pre-pandemic levels.

The red line is for 2024. The black line is for 2019. Note that inventory is up 86% from the record low for the same week in 2022, but still well below normal levels.
Inventory was up 33.1% compared to the same week in 2023 (last week it was up 31.8%), and down 36.8% compared to the same week in 2019 (last week it was down 35.9%).
Back in June 2023, inventory was down almost 54% compared to 2019, so the gap to more normal inventory levels is slowly closing.
Mike Simonsen discusses this data regularly on Youtube.
Sunday, May 05, 2024
Sunday Night Futures
by Calculated Risk on 5/05/2024 06:50:00 PM
Weekend:
• Schedule for Week of May 5, 2024
Monday:
• At 2:00 PM ET, Senior Loan Officer Opinion Survey on Bank Lending Practices for April.
From CNBC: Pre-Market Data and Bloomberg futures S&P 500 are up 10 and DOW futures are up 80 (fair value).
Oil prices were up over the last week with WTI futures at $78.11 per barrel and Brent at $82.96 per barrel. A year ago, WTI was at $71, and Brent was at $76 - so WTI oil prices are up about 10% year-over-year.
Here is a graph from Gasbuddy.com for nationwide gasoline prices. Nationally prices are at $3.62 per gallon. A year ago, prices were at $3.52 per gallon, so gasoline prices are up $0.10 year-over-year.
Hotels: Occupancy Rate decreased 1.2% Year-over-year
by Calculated Risk on 5/05/2024 08:21:00 AM
As expected with Passover, U.S. hotel performance came in lower than the previous week and comparable period last year, according to CoStar’s latest data through 27 April. ...The following graph shows the seasonal pattern for the hotel occupancy rate using the four-week average.
21-27 April 2024 (percentage change from comparable week in 2023):
• Occupancy: 65.7% (-1.2%)
• Average daily rate (ADR): US$154.44 (-1.3%)
• Revenue per available room (RevPAR): US$101.42 (-2.5%)
emphasis added
 Click on graph for larger image.
The red line is for 2024, black is 2020, blue is the median, and dashed light blue is for 2023. Dashed purple is for 2018, the record year for hotel occupancy.
The 4-week average of the occupancy rate is slightly above last year, and above the median rate for the period 2000 through 2023 (Blue).
Note: Y-axis doesn't start at zero to better show the seasonal change.
The 4-week average of the occupancy rate will move mostly sideways seasonally until the summer travel season.
Saturday, May 04, 2024
Real Estate Newsletter Articles this Week: National House Price Index Up 6.4% year-over-year in February
by Calculated Risk on 5/04/2024 02:11:00 PM
At the Calculated Risk Real Estate Newsletter this week:
• Case-Shiller: National House Price Index Up 6.4% year-over-year in February
• Inflation Adjusted House Prices 2.4% Below Peak
• Lawler: Update on Mortgage Rates and Spreads and also New / Renewal Rents
• Freddie Mac House Price Index Increased in March; Up 6.6% Year-over-year
This is usually published 4 to 6 times a week and provides more in-depth analysis of the housing market.
Schedule for Week of May 5, 2024
by Calculated Risk on 5/04/2024 08:11:00 AM
This will be a very light week for economic data.
2:00 PM: Senior Loan Officer Opinion Survey on Bank Lending Practices for April.
No major economic releases scheduled.
7:00 AM ET: The Mortgage Bankers Association (MBA) will release the results for the mortgage purchase applications index.
8:30 AM: The initial weekly unemployment claims report will be released. The consensus is for 206 thousand initial claims, down from 208 thousand last week.
10:00 AM: University of Michigan's Consumer sentiment index (Preliminary for May).


