by Calculated Risk on 5/10/2024 11:30:00 AM
Friday, May 10, 2024
Q2 GDP Tracking: 3%+
From Goldman:
We boosted our Q2 GDP tracking estimate by 0.1pp to +3.4% (qoq ar) and left our domestic final sales estimate unchanged at +2.7%. [May 7th estimate]And from the Altanta Fed: GDPNow
emphasis added
The GDPNow model estimate for real GDP growth (seasonally adjusted annual rate) in the second quarter of 2024 is 4.2 percent on May 8, up from 3.3 percent on May 2. After recent releases from the US Bureau of Economic Analysis, the US Census Bureau, the Institute for Supply Management, and the US Census Bureau, the nowcasts of second-quarter real personal consumption expenditures growth and second-quarter real gross private domestic investment growth increased from 3.2 percent and 4.1 percent, respectively, to 3.9 percent and 6.8 percent, while the nowcast of the contribution of the change in real net exports to second-quarter real GDP growth decreased from -0.05 percentage points to -0.10 percentage points. [May 8th estimate]
Hotels: Occupancy Rate decreased 0.8% Year-over-year
by Calculated Risk on 5/10/2024 08:21:00 AM
U.S. hotel performance showed mixed results from the previous week, according to CoStar’s latest data through 4 May. ...The following graph shows the seasonal pattern for the hotel occupancy rate using the four-week average.
28 April through 4 May 2024 (percentage change from comparable week in 2023):
• Occupancy: 64.4% (-0.8%)
• Average daily rate (ADR): US$159.97 (+1.3%)
• Revenue per available room (RevPAR): US$103.09 (+0.5%)
emphasis added
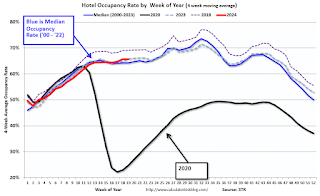 Click on graph for larger image.
The red line is for 2024, black is 2020, blue is the median, and dashed light blue is for 2023. Dashed purple is for 2018, the record year for hotel occupancy.
Thursday, May 09, 2024
"Mortgage Rates Technically at Lowest Levels in a Month"
by Calculated Risk on 5/09/2024 07:18:00 PM
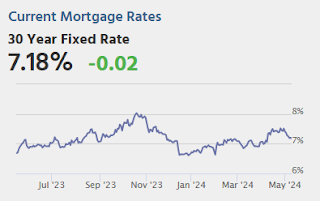
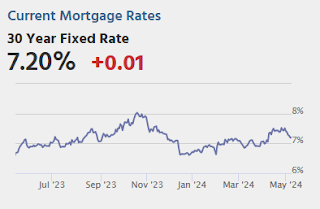
The most prevalently quoted conventional 30yr fixed rates are at the lowest levels in a month as of today, but there are a few "yeah buts" ... the above has played out in a very narrow range in the bigger picture. The big spike on April 10th was in a completely different league and it was exclusively a response to the Consumer Price Index (CPI). With that in mind, the next CPI will be released next Wednesday. It has just as much power to cause just as big of a move as it did last time, for better or worse. [30 year fixed 7.18%]Tuesday:
emphasis added
• At 10:00 AM ET, University of Michigan's Consumer sentiment index (Preliminary for May).
Housing Starts: Record Average Length of Time from Start to Completion in 2023
by Calculated Risk on 5/09/2024 12:47:00 PM
Today, in the Calculated Risk Real Estate Newsletter: Housing Starts: Record Average Length of Time from Start to Completion in 2023
A brief excerpt:
In 2023, it took a record 8.6 months from start to completion for single family homes, up from an already elevated 8.3 months in 2022. For 2+ unit buildings, it took a record 17.1 months for buildings with 2 or more units in 2023, unchanged from 17.1 months in 2022.There is more in the article.
...
The delays following the housing bubble were due to many projects being mothballed for several years. The recent delays were due to pandemic related supply constraints.
Realtor.com Reports Active Inventory Up 35.1% YoY; New Listings Up 3.6% YoY
by Calculated Risk on 5/09/2024 11:30:00 AM
What this means: On a weekly basis, Realtor.com reports the year-over-year change in active inventory and new listings. On a monthly basis, they report total inventory. For April, Realtor.com reported inventory was up 30.4% YoY, but still down almost 36% compared to April 2017 to 2019 levels.
Realtor.com has monthly and weekly data on the existing home market. Here is their weekly report: Weekly Housing Trends View—Data for Week Ending May 4, 2024
• Active inventory increased, with for-sale homes 35.1% above year-ago levels
For the 26th straight week, there were more homes listed for sale versus the prior year, giving homebuyers more options. As mortgage rates have climbed to new 2024 highs, we could see sellers adjust their plans, since nearly three-quarters of potential sellers also plan to buy a home. However, the long buildup to listing—80% have been thinking about selling for 1 to 3 years—could mean that this year’s sellers are less deterred by market fluctuations.
• New listings—a measure of sellers putting homes up for sale—were up this week, by 3.6% from one year ago
Although the number of new listings kept rising, the rate of increase slowed considerably compared with the double-digit surges seen in recent weeks. This slowdown highlighted the extent to which sellers’ sentiments are influenced by mortgage rates.
As mortgage rates breach 7% once more, numerous home sellers might be inclined to postpone their selling endeavors. Should mortgage rates persist in their ascent, they will continue to suppress listing activities.
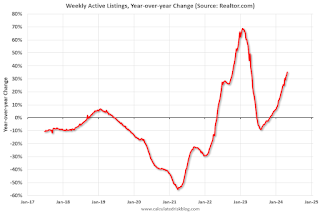 Here is a graph of the year-over-year change in inventory according to realtor.com.
 Inventory was up year-over-year for the 26th consecutive week.
Weekly Initial Unemployment Claims Increase to 231,000
by Calculated Risk on 5/09/2024 08:30:00 AM
The DOL reported:
In the week ending May 4, the advance figure for seasonally adjusted initial claims was 231,000, an increase of 22,000 from the previous week's revised level. The previous week's level was revised up by 1,000 from 208,000 to 209,000. The 4-week moving average was 215,000, an increase of 4,750 from the previous week's revised average. The previous week's average was revised up by 250 from 210,000 to 210,250.The following graph shows the 4-week moving average of weekly claims since 1971.
emphasis added
 Click on graph for larger image.
The dashed line on the graph is the current 4-week average. The four-week average of weekly unemployment claims increased to 215,000.
The previous week was revised up.
Weekly claims were much higher than the consensus forecast.
Wednesday, May 08, 2024
Thursday: Unemployment Claims
by Calculated Risk on 5/08/2024 07:57:00 PM
Thursday:
• At 8:30 AM ET, The initial weekly unemployment claims report will be released. The consensus is for 206 thousand initial claims, down from 208 thousand last week.
Leading Index for Commercial Real Estate Increased 6% in April
by Calculated Risk on 5/08/2024 02:53:00 PM
From Dodge Data Analytics: Dodge Momentum Index Rose 6% in April
The Dodge Momentum Index (DMI), issued by Dodge Construction Network, increased 6.1% in April to 173.9 (2000=100) from the revised March reading of 164.0. Over the month, commercial planning improved 12.6% and institutional planning dropped 6.3%.
“The Dodge Momentum Index (DMI) saw positive progress in April, alongside a deluge of data center projects that entered the planning stage,” stated Sarah Martin, associate director of forecasting at Dodge Construction Network. “Outsized demand to build Cloud and AI infrastructure is supporting above-average activity in the sector. Most other categories, however, faced slower growth over the month. Across these industries, it’s likely that owners and developers are grappling with uncertainty around interest rates and labor shortages, thus delaying their decisions to push projects into the planning queue. If interest rates begin to tick down in the latter half of 2024, more substantive growth in nonresidential planning activity should follow.”
A flood of data center projects entered planning in April, causing robust growth in the commercial segment of the DMI, while traditional office and hotel projects continued to face slower momentum. Warehouse planning was basically flat. On the institutional side, education and healthcare planning activity receded again – in part, driven by another month of weak life science and R&D laboratory activity. Year over year, the DMI was 1% lower than in April 2023. The commercial segment was up 6% from year-ago levels, while the institutional segment was down 15% over the same period.
...
The DMI is a monthly measure of the value of nonresidential building projects going into planning, shown to lead construction spending for nonresidential buildings by a full year.
emphasis added
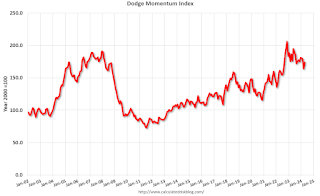 Click on graph for larger image.
This graph shows the Dodge Momentum Index since 2002. The index was at 173.9 in April, up from 164.0 the previous month.
According to Dodge, this index leads "construction spending for nonresidential buildings by a full year". This index suggests a slowdown in 2024.
1st Look at Local Housing Markets in April
by Calculated Risk on 5/08/2024 11:57:00 AM
Today, in the Calculated Risk Real Estate Newsletter: 1st Look at Local Housing Markets in April
A brief excerpt:
NOTE: The tables for active listings, new listings and closed sales all include a comparison to April 2019 for each local market (some 2019 data is not available).There is much more in the article.
This is the first look at several early reporting local markets in April. I’m tracking over 40 local housing markets in the US. Some of the 40 markets are states, and some are metropolitan areas. I’ll update these tables throughout the month as additional data is released.
Closed sales in April were mostly for contracts signed in February and March when 30-year mortgage rates averaged 6.78% and 6.82%, respectively (Freddie Mac PMMS). This is down from the 7%+ mortgage rates in the August through November period (although rates are now back above 7% again)..
...
In April, sales in these markets were up 10.2% YoY. In March, these same markets were down 9.4% year-over-year Not Seasonally Adjusted (NSA).
Sales in most of these markets are down compared to January 2019. Sales in Nashville are up compared to 2019.
...
This is a year-over-year increase NSA for these early reporting markets. However, there were two more working days in April 2024 compared to April 2023, so sales Seasonally Adjusted will be lower year-over-year than Not Seasonally Adjusted sales.
...
This was just a few early reporting markets. Many more local markets to come!
Update: Lumber Prices Mostly Unchanged YoY
by Calculated Risk on 5/08/2024 09:58:00 AM
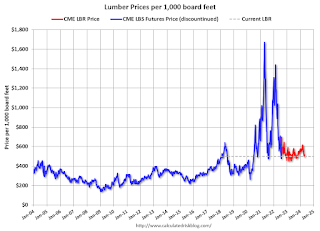
This graph shows CME random length framing futures through last August (blue), and the new physically-delivered Lumber Futures (LBR) contract starting in August 2022 (Red).

