 RSS Feed
 by Calculated Risk on 5/23/2024 08:30:00 AM
Thursday, May 23, 2024
Weekly Initial Unemployment Claims Decrease to 215,000
The DOL reported:
In the week ending May 18, the advance figure for seasonally adjusted initial claims was 215,000, a decrease of 8,000 from the previous week's revised level. The previous week's level was revised up by 1,000 from 222,000 to 223,000. The 4-week moving average was 219,750, an increase of 1,750 from the previous week's revised average. The previous week's average was revised up by 250 from 217,750 to 218,000.The following graph shows the 4-week moving average of weekly claims since 1971.
emphasis added
 Click on graph for larger image.
The dashed line on the graph is the current 4-week average. The four-week average of weekly unemployment claims increased to 219,750.
The previous week was revised up.
Weekly claims were lower than the consensus forecast.
Wednesday, May 22, 2024
Thursday: New Home Sales, Unemployment Claims
by Calculated Risk on 5/22/2024 07:51:00 PM
 Note: Mortgage rates are from MortgageNewsDaily.com and are for top tier scenarios.
Thursday:
• At 8:30 AM ET, The initial weekly unemployment claims report will be released. The consensus is for 220 thousand initial claims, down from 222 thousand last week.
• Also at 8:30 AM, Chicago Fed National Activity Index for April. This is a composite index of other data.
• At 10:00 AM, New Home Sales for April from the Census Bureau. The consensus is for 680 thousand SAAR, down from 693 thousand SAAR in March.
• At 11:00 AM, the Kansas City Fed manufacturing survey for May.
AIA: Architecture Billings Decline in April; Multi-family Billings Decline for 21st Consecutive Month
by Calculated Risk on 5/22/2024 03:48:00 PM
Note: This index is a leading indicator primarily for new Commercial Real Estate (CRE) investment.
From the AIA: ABI April 2024: Pace of billings decline at architecture firms slows slightly
While the AIA/Deltek Architecture Billings Index (ABI) score for the month rose from 43.6 in March to 48.3 in April, it indicates that billings continued to decline at the majority of firms (a score below 50 indicates declining billings). Inquiries into new projects continued to increase, as there remains interest in starting new projects. However, the value of newly signed design contracts dipped slightly in April, as clients remain hesitant to commit to new work. Firms had hoped that the Federal Reserve would start lowering interest rates this spring and that would open new work, but with that decrease now likely on hold until late summer or early fall, firms may have some more slow months ahead of them.• Northeast (56.9); Midwest (44.2); South (44.6); West (47.8)
Architecture firm billings continued to decline at firms in all regions of the country in April as well, with firms located in the Midwest and South reporting the largest declines. The current longest duration of decline is found at firms located in the West, where billings have now declined for the last 19 consecutive months. Business conditions also remain soft at firms of all specializations, with the weakest conditions continuing at firms with a multifamily residential specialization, followed by those with an institutional specialization, and then those with a commercial/industrial specialization.
...
The ABI score is a leading economic indicator of construction activity, providing an approximately nine-to-twelve-month glimpse into the future of nonresidential construction spending activity. The score is derived from a monthly survey of architecture firms that measures the change in the number of services provided to clients.
emphasis added
• Sector index breakdown: commercial/industrial (47.4); institutional (46.1); multifamily residential (45.6)
 Click on graph for larger image.
This graph shows the Architecture Billings Index since 1996. The index was at 48.3 in April, up from 43.6 in March. Anything below 50 indicates a decrease in demand for architects' services.
Note: This includes commercial and industrial facilities like hotels and office buildings, multi-family residential, as well as schools, hospitals and other institutions.
This index usually leads CRE investment by 9 to 12 months, so this index suggests a slowdown in CRE investment in 2024.
Note that multi-family billing turned down in August 2022 and has been negative for twenty one consecutive months (with revisions). This suggests we will see a further weakness in multi-family starts.
FOMC Minutes: "Recent increases in inflation had been relatively broad based"
by Calculated Risk on 5/22/2024 02:00:00 PM
From the Fed: Minutes of the Federal Open Market Committee, April 30–May 1, 2024. Excerpt:
Participants observed that while inflation had eased over the past year, in recent months there had been a lack of further progress toward the Committee's 2 percent objective. The recent monthly data had showed significant increases in components of both goods and services price inflation. In particular, inflation for core services excluding housing had moved up in the first quarter compared with the fourth quarter of last year, and prices of core goods posted their first three-month increase in several months. In addition, housing services inflation had slowed less than had been anticipated based on the smaller increases in measures of market rents over the past year. A few participants remarked that unusually large seasonal patterns could have contributed to January's large increase in PCE inflation, and several participants noted that some components that typically display volatile price changes had boosted recent readings. However, some participants emphasized that the recent increases in inflation had been relatively broad based and therefore should not be overly discounted.
Participants generally commented that they remained highly attentive to inflation risks. They also remained concerned that elevated inflation continued to harm the purchasing power of households, especially those least able to meet the higher costs of essentials like food, housing, and transportation.
Participants noted that they continued to expect that inflation would return to 2 percent over the medium term. However, recent data had not increased their confidence in progress toward 2 percent and, accordingly, had suggested that the disinflation process would likely take longer than previously thought.
emphasis added
NAR: Existing-Home Sales Decreased to 4.14 million SAAR in April; Median House Prices Increased 5.7% Year-over-Year
by Calculated Risk on 5/22/2024 01:13:00 PM
Today, in the CalculatedRisk Real Estate Newsletter: NAR: Existing-Home Sales Decreased to 4.14 million SAAR in April
Excerpt:
Sales Year-over-Year and Not Seasonally Adjusted (NSA)There is much more in the article.
The fourth graph shows existing home sales by month for 2023 and 2024.
Sales declined 1.9% year-over-year compared to March 2023. This was the thirty-second consecutive month with sales down year-over-year.

NAR: Existing-Home Sales Decreased to 4.14 million SAAR in April
by Calculated Risk on 5/22/2024 10:00:00 AM
From the NAR: Existing-Home Sales Retreated 1.9% in April
Existing-home sales receded in April, according to the National Association of REALTORS®. All four major U.S. regions posted month-over-month declines. Year-over-year, sales decreased in the Northeast, Midwest and South but increased in the West.
Total existing-home sales – completed transactions that include single-family homes, townhomes, condominiums and co-ops – slid 1.9% from March to a seasonally adjusted annual rate of 4.14 million in April. Year-over-year, sales fell 1.9% (down from 4.22 million in April 2023).
...
Total housing inventory registered at the end of April was 1.21 million units, up 9% from March and 16.3% from one year ago (1.04 million). Unsold inventory sits at a 3.5-month supply at the current sales pace, up from 3.2 months in March and 3.0 months in April 2023.
emphasis added
 Click on graph for larger image.
This graph shows existing home sales, on a Seasonally Adjusted Annual Rate (SAAR) basis since 1994.
Sales in April (4.14 million SAAR) were down 1.9% from the previous month and were 1.9% below the April 2023 sales rate.
The second graph shows nationwide inventory for existing homes.
 According to the NAR, inventory increased to 1.21 million in April from 1.11 million the previous month.
 According to the NAR, inventory increased to 1.21 million in April from 1.11 million the previous month.
Headline inventory is not seasonally adjusted, and inventory usually decreases to the seasonal lows in December and January, and peaks in mid-to-late summer.
The last graph shows the year-over-year (YoY) change in reported existing home inventory and months-of-supply. Since inventory is not seasonally adjusted, it really helps to look at the YoY change. Note: Months-of-supply is based on the seasonally adjusted sales and not seasonally adjusted inventory.
 Inventory was up 16.3% year-over-year (blue) in April compared to April 2023.
Months of supply (red) increased to 3.5 months in April from 3.2 months the previous month.
This was below the consensus forecast. I'll have more later.
The last graph shows the year-over-year (YoY) change in reported existing home inventory and months-of-supply. Since inventory is not seasonally adjusted, it really helps to look at the YoY change. Note: Months-of-supply is based on the seasonally adjusted sales and not seasonally adjusted inventory.
 Inventory was up 16.3% year-over-year (blue) in April compared to April 2023.
 Months of supply (red) increased to 3.5 months in April from 3.2 months the previous month.
This was below the consensus forecast. I'll have more later.
MBA: Mortgage Applications Increased in Weekly Survey
by Calculated Risk on 5/22/2024 07:00:00 AM
From the MBA: Mortgage Applications Increase in Latest MBA Weekly Survey
Mortgage applications increased 1.9 percent from one week earlier, according to data from the Mortgage Bankers Association’s (MBA) Weekly Mortgage Applications Survey for the week ending May 17, 2024.
The Market Composite Index, a measure of mortgage loan application volume, increased 1.9 percent on a seasonally adjusted basis from one week earlier. On an unadjusted basis, the Index increased 1.1 percent compared with the previous week. The Refinance Index increased 7 percent from the previous week and was 21 percent higher than the same week one year ago. The seasonally adjusted Purchase Index decreased 1 percent from one week earlier. The unadjusted Purchase Index decreased 2 percent compared with the previous week and was 11 percent lower than the same week one year ago.
“The 30-year fixed mortgage rate declined for the third straight week, dropping to 7.01 percent – the lowest level in seven weeks,” said Joel Kan, MBA’s Vice President and Deputy Chief Economist. “Rates coming down from recent highs spurred some borrowers to act, with increases across both conventional and government refinance applications. VA refinances had a double-digit increase for the third consecutive week, although the current level of refinancing is still well below its historical average. Purchase activity continues to lag despite this recent decline in rates, down 11 percent from a year ago, as potential buyers still face limited for-sale inventory and high list prices.”
...
The average contract interest rate for 30-year fixed-rate mortgages with conforming loan balances ($766,550 or less) decreased to 7.01 percent from 7.08 percent, with points decreasing to 0.60 from 0.63 (including the origination fee) for 80 percent loan-to-value ratio (LTV) loans.
emphasis added
 Click on graph for larger image.
The first graph shows the MBA mortgage purchase index.
According to the MBA, purchase activity is down 11% year-over-year unadjusted.
Red is a four-week average (blue is weekly).
Purchase application activity is up slightly from the lows in late October 2023, and below the lowest levels during the housing bust.

The second graph shows the refinance index since 1990.
With higher mortgage rates, the refinance index declined sharply in 2022, and mostly flat lined since then with a slight increase recently.
Tuesday, May 21, 2024
Wednesday: Existing Home Sales, FOMC Minutes, Architecture Billings Index
by Calculated Risk on 5/21/2024 07:22:00 PM
 Note: Mortgage rates are from MortgageNewsDaily.com and are for top tier scenarios.
Wednesday:
• At 7:00 AM ET, The Mortgage Bankers Association (MBA) will release the results for the mortgage purchase applications index.
• At 10:00 AM, Existing Home Sales for April from the National Association of Realtors (NAR). The consensus is for 4.18 million SAAR, down from 4.19 million. Housing economist Tom Lawler expects the NAR to report sales of 4.23 million SAAR.
• During the day, The AIA's Architecture Billings Index for April (a leading indicator for commercial real estate).
• At 2:00 PM, FOMC Minutes, Minutes Meeting of April 30-May 1, 2024
LA Port Traffic Increased Year-over-year in April
by Calculated Risk on 5/21/2024 01:00:00 PM
Container traffic gives us an idea about the volume of goods being exported and imported - and usually some hints about the trade report since LA area ports handle about 40% of the nation's container port traffic.
The following graphs are for inbound and outbound traffic at the ports of Los Angeles and Long Beach in TEUs (TEUs: 20-foot equivalent units or 20-foot-long cargo container).
To remove the strong seasonal component for inbound traffic, the first graph shows the rolling 12-month average.
 Click on graph for larger image.
On a rolling 12-month basis, inbound traffic increased 1.4% in April compared to the rolling 12 months ending in March. Outbound traffic increased 0.8% compared to the rolling 12 months ending the previous month.
The 2nd graph is the monthly data (with a strong seasonal pattern for imports).
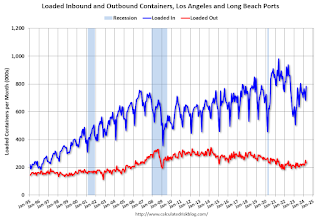 Usually imports peak in the July to October period as retailers import goods for the Christmas holiday, and then decline sharply and bottom in the Winter depending on the timing of the Chinese New Year.
 Usually imports peak in the July to October period as retailers import goods for the Christmas holiday, and then decline sharply and bottom in the Winter depending on the timing of the Chinese New Year.
 Imports were up 16% YoY in April, and exports were up 10% YoY.
In general, it appears port traffic is returning to the pre-pandemic patterns.
Single Family Built-for-Rent Up 20% Year-over-year in Q1
by Calculated Risk on 5/21/2024 09:45:00 AM
Today, in the Calculated Risk Real Estate Newsletter: Single Family Built-for-Rent Up 20% Year-over-year in Q1
A brief excerpt:
Along with the monthly housing starts report for April released last week, the Census Bureau also released Housing Units Started by Purpose and Design through Q1 2024.There is much more in the article.
The first graph shows the number of single family and multi-family units started with the intent to rent. This data is quarterly and Not Seasonally Adjusted (NSA). Although the majority of units built-for-rent’ are still multi-family (blue), there has been a significant pickup in single family units started built-for-rent (red).
In 2020, there were 44,000 single family units started with the intent to rent. In 2023, that number almost doubled to 85,000 units. There were 18,000 single family units started in Q1 2024 built-for-rent, up 20% from 15,000 in Q1 2023.
For multi-family, there were 56,000 units started to rent in Q1 2024, down almost 50% from 108,000 in Q1 2023.


