by Calculated Risk on 5/29/2024 08:02:00 PM
Wednesday, May 29, 2024
Thursday: GDP, Unemployment Claims, Pending Home Sales
Thursday:
• At 8:30 AM ET, The initial weekly unemployment claims report will be released. The consensus is for 218 thousand initial claims, up from 215 thousand last week.
• Also at 8:30 AM, Gross Domestic Product, 1st quarter 2023 (Second estimate). The consensus is that real GDP increased 1.2% annualized in Q1, down from the advance estimate of 1.6%.
• At 10:00 AM, Pending Home Sales Index for April. The consensus is for a 0.6% decrease in the index.
Las Vegas April 2024: Visitor Traffic Up 3.8% YoY; Convention Traffic Up 36%
by Calculated Risk on 5/29/2024 05:00:00 PM
From the Las Vegas Visitor Authority: April 2024 Las Vegas Visitor Statistics
With strength in both leisure and conventions segments, Las Vegas visitation in April exceeded 3.5M, up +3.8% YoY.
Convention attendance saw a YoY increase of 36% related in part to scheduling differences of some shows such as the ISC West ‐ International Security Conference (20K attendees, in Apr 2024 vs. Mar last year) along with new shows including the Google Cloud Next show (30k attendees), the Craft Brewers Conference (12k attendees) and the PZ3 Live Veterinary & Pet Technology Conference (5k attendees).
Even with a larger room count vs. last April, overall hotel occupancy reached 85.5% (up 1.2 pts), with Weekend occupancy of 93.4% (up 1.0 pts) and Midweek occupancy reaching 82.6% (up 1.7 pts) . ADR exceeded $182 while RevPAR approached $156, showing YoY increases of 6.6% and 8.1%, respectively.
emphasis added
 Click on graph for larger image.
 The first graph shows visitor traffic for 2019 (Black), 2020 (dark blue), 2021 (light blue), 2022 (light orange), 2023 (dark orange) and 2024 (red).
Visitor traffic was up 3.8% compared to last April. Visitor traffic was down 0.8% compared to the same month in 2019.
FDIC: Number of Problem Banks Increased in Q1 2024
by Calculated Risk on 5/29/2024 01:36:00 PM
The FDIC released the Quarterly Banking Profile for Q1 2024:
Reports from 4,568 commercial banks and savings institutions insured by the Federal Deposit Insurance Corporation (FDIC) report aggregate net income of $64.2 billion in first quarter 2024, an increase of $28.4 billion (79.5 percent) from the prior quarter. A large decline in noninterest expense because of several substantial, non-recurring items recognized by large banks in the prior quarter, as well as higher noninterest income and lower provision expenses this quarter, contributed to the quarterly increase. These and other financial results for first quarter 2024 are included in the FDIC’s latest Quarterly Banking Profile released today.
...
Asset Quality Metrics Remained Generally Favorable With the Exception of Material Deterioration in Credit Card and Commercial Real Estate (CRE) Portfolios: Loans that were 90 days or more past due or in nonaccrual status increased to 0.91 percent of total loans, up five basis points from the prior quarter and 16 basis points from the year-ago quarter. The quarterly increase was led by commercial and industrial loans and non-owner-occupied CRE loans. The noncurrent rate for non-owner occupied CRE loans of 1.59 percent is now at its highest level since fourth quarter 2013, driven by office portfolios at the largest banks. Despite the recent increases, the industry’s total noncurrent ratio remains 37 basis points below the pre-pandemic average of 1.28 percent.
emphasis added
 Click on graph for larger image.
From the FDIC:
The number of banks on the FDIC’s “Problem Bank List” increased from 52 to 63. Total assets held by problem banks rose $15.8 billion to $82.1 billion. Problem banks represent 1.4 percent of total banks, which is within the normal range for non-crisis periods of 1 to 2 percent of all banks.This graph from the FDIC shows the number of problem banks and assets at problem institutions.
Note: The number of assets for problem banks increased significantly back in 2018 when Deutsche Bank Trust Company Americas was added to the list. An even larger unknown bank was added to the list in Q4 2021, however that bank is now off the problem list.
Inflation Adjusted House Prices 2.2% Below Peak; Price-to-rent index is 7.5% below 2022 peak
by Calculated Risk on 5/29/2024 10:34:00 AM
Today, in the Calculated Risk Real Estate Newsletter: Inflation Adjusted House Prices 2.2% Below Peak
Excerpt:
It has been 18 years since the bubble peak. In the March Case-Shiller house price index released on Tuesday, the seasonally adjusted National Index (SA), was reported as being 72% above the bubble peak in 2006. However, in real terms, the National index (SA) is about 10% above the bubble peak (and historically there has been an upward slope to real house prices). The composite 20, in real terms, is 1% above the bubble peak.
People usually graph nominal house prices, but it is also important to look at prices in real terms. As an example, if a house price was $300,000 in January 2010, the price would be $431,000 today adjusted for inflation (44% increase). That is why the second graph below is important - this shows "real" prices.
The third graph shows the price-to-rent ratio, and the fourth graph is the affordability index. The last graph shows the 5-year real return based on the Case-Shiller National Index.
...
The second graph shows the same two indexes in real terms (adjusted for inflation using CPI).
In real terms (using CPI), the National index is 2.2% below the recent peak, and the Composite 20 index is 3.1% below the recent peak in 2022. Both indexes declined slightly in March in real terms.
MBA: Mortgage Applications Decreased in Weekly Survey
by Calculated Risk on 5/29/2024 07:00:00 AM
From the MBA: Mortgage Applications Decrease in Latest MBA Weekly Survey
Mortgage applications decreased 5.7 percent from one week earlier, according to data from the Mortgage Bankers Association’s (MBA) Weekly Mortgage Applications Survey for the week ending May 24, 2024.
The Market Composite Index, a measure of mortgage loan application volume, decreased 5.7 percent on a seasonally adjusted basis from one week earlier. On an unadjusted basis, the Index decreased 6.3 percent compared with the previous week. The Refinance Index decreased 14 percent from the previous week and was 12 percent higher than the same week one year ago. The seasonally adjusted Purchase Index decreased 1 percent from one week earlier. The unadjusted Purchase Index decreased 3 percent compared with the previous week and was 10 percent lower than the same week one year ago.
“Mortgage rates increased for the first time in four weeks, with the 30-year fixed rate up to 7.05 percent and all other loan types also seeing increases. The uptick in rates led to a decline in mortgage applications heading into Memorial Day weekend,” said Joel Kan, MBA’s Vice President and Deputy Chief Economist. “Both purchase and refinance applications fell, pushing overall activity to the lowest level since early March. Borrowers remain sensitive to small increases in rates, impacting the refinance market and keeping purchase applications below last year’s levels. There continues to be limited levels of existing homes for sale and many buyers are struggling to find listings in their price range that meet their needs.”
...
The average contract interest rate for 30-year fixed-rate mortgages with conforming loan balances ($766,550 or less) increased to 7.05 percent from 7.01 percent, with points increasing to 0.63 from 0.60 (including the origination fee) for 80 percent loan-to-value ratio (LTV) loans.
emphasis added
 Click on graph for larger image.
The first graph shows the MBA mortgage purchase index.
According to the MBA, purchase activity is down 10% year-over-year unadjusted.

Tuesday, May 28, 2024
Wednesday: Beige Book, Richmond Fed Mfg
by Calculated Risk on 5/28/2024 07:12:00 PM
Wednesday:
• At 7:00 AM ET, The Mortgage Bankers Association (MBA) will release the results for the mortgage purchase applications index.
• At 10:00 AM, Richmond Fed Survey of Manufacturing Activity for May.
• At 2:00 PM, the Federal Reserve Beige Book, an informal review by the Federal Reserve Banks of current economic conditions in their Districts.
A few comments on the Seasonal Pattern for House Prices
by Calculated Risk on 5/28/2024 01:35:00 PM
Two key points:
1) There is a clear seasonal pattern for house prices.
2) The surge in distressed sales during the housing bust distorted the seasonal pattern. This was because distressed sales (at lower price points) happened at a steady rate all year, while regular sales followed the normal seasonal pattern. This made for larger swings in the seasonal factor during the housing bust.
Click on graph for larger image.
This graph shows the month-to-month change in the NSA Case-Shiller National index since 1987 (through March 2024). The seasonal pattern was smaller back in the '90s and early '00s and increased once the bubble burst.
The seasonal swings declined following the bust, however the pandemic price surge changed the month-over-month pattern.
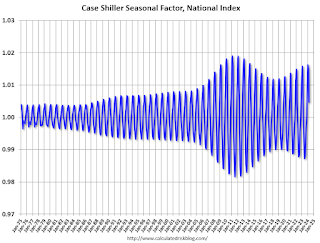
The swings in the seasonal factors were decreasing following the bust but have increased again recently - this time without a surge in distressed sales.
Comments on March House Prices, FHFA: House Prices Increased 0.1% in March
by Calculated Risk on 5/28/2024 09:50:00 AM
Today, in the Calculated Risk Real Estate Newsletter: Case-Shiller: National House Price Index Up 6.5% year-over-year in March; FHFA: House Prices Increased 0.1% in March, up 6.6% YoY
Excerpt:
S&P/Case-Shiller released the monthly Home Price Indices for March ("March" is a 3-month average of January, February and March closing prices). March closing prices include some contracts signed in November, so there is a significant lag to this data. Here is a graph of the month-over-month (MoM) change in the Case-Shiller National Index Seasonally Adjusted (SA).
The MoM increase in the seasonally adjusted (SA) Case-Shiller National Index was at 0.30%. This was the fourteenth consecutive MoM increase, but a smaller MoM increase than the previous two months.
On a seasonally adjusted basis, prices increased month-to-month in 15 of the 20 Case-Shiller cities. Seasonally adjusted, San Francisco has fallen 8.2% from the recent peak, Seattle is down 6.0% from the peak, Portland down 4.0%, and Phoenix is down 3.1%.
Case-Shiller: National House Price Index Up 6.5% year-over-year in March
by Calculated Risk on 5/28/2024 09:00:00 AM
S&P/Case-Shiller released the monthly Home Price Indices for March ("March" is a 3-month average of January, February and March closing prices).
This release includes prices for 20 individual cities, two composite indices (for 10 cities and 20 cities) and the monthly National index.
From S&P S&P CoreLogic Case-Shiller Index Hits New All-Time High in March 2024
The S&P CoreLogic Case-Shiller U.S. National Home Price NSA Index, covering all nine U.S. census divisions, reported a 6.5% annual gain for March, the same increase as the previous month. The 10- City Composite saw an increase of 8.2%, up from a 8.1% increase in the previous month. The 20-City Composite posted a slight year-over-year increase to 7.4%, up from a 7.3% increase in the previous month. San Diego continued to report the highest year-over-year gain among the 20 cities this month with an 11.1% increase in March, followed by New York and Cleveland, with increases of 9.2% and 8.8%, respectively. Portland, which still holds the lowest rank after reporting three consecutive months of the smallest year-over-year growth, posted the same 2.2% annual increase in March as the previous month.
...
The U.S. National Index, the 20-City Composite, and the 10-City Composite all continued their upward trend from last month, showing pre-seasonality adjustment increases of 1.3%, 1.6% and 1.6%, respectively.
After seasonal adjustment, the U.S. National Index posted a month-over-month increase of 0. 3%, while the 20-City and the 10-City Composite both reported month-over-month increases of 0.3% and 0.5%, respectively.
“This month’s report boasts another all-time high,” says Brian D. Luke, Head of Commodities, Real & Digital Assets at S&P Dow Jones Indices. “We’ve witnessed records repeatedly break in both stock and housing markets over the past year. Our National Index has reached new highs in six of the last 12 months. During that time, we’ve seen record stock market performance, with the S&P 500 hitting fresh all-time highs for 35 trading days in the past year.
“San Diego stands out with an impressive 11.1% annual gain, followed closely by New York, Cleveland, and Los Angeles, indicating a strong demand for urban markets."
emphasis added
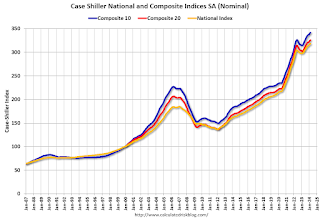 Click on graph for larger image.
 The first graph shows the nominal seasonally adjusted Composite 10, Composite 20 and National indices (the Composite 20 was started in January 2000).
The Composite 10 index was up 0.5% in March (SA). The Composite 20 index was up 0.3% (SA) in March.
The National index was up 0.3% (SA) in March.
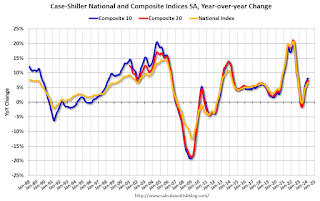 The second graph shows the year-over-year change in all three indices.
The Composite 10 SA was up 8.2% year-over-year. The Composite 20 SA was up 7.4% year-over-year.
The National index SA was up 6.5% year-over-year.
Annual price changes were close to expectations. I'll have more later.
Monday, May 27, 2024
Tuesday: Case-Shiller House Prices
by Calculated Risk on 5/27/2024 06:10:00 PM
Weekend:
• Schedule for Week of May 26, 2024
Tuesday:
• At 9:00 AM ET, S&P/Case-Shiller House Price Index for March. The consensus is for the Case-Shiller National Index to increase 6.8% YoY, up from 6.4% YoY in February.
• Also at 9:00 AM, FHFA House Price Index for March. This was originally a GSE only repeat sales, however there is also an expanded index.
• At 10:00 AM, Dallas Fed Survey of Manufacturing Activity for May.
From CNBC: Pre-Market Data and Bloomberg futures S&P 500 are up 11 and DOW futures are up 51 (fair value).
Oil prices were down over the last week with WTI futures at $78.38 per barrel and Brent at $82.79 per barrel. A year ago, WTI was at $72, and Brent was at $76 - so WTI oil prices are up about 9% year-over-year.
Here is a graph from Gasbuddy.com for nationwide gasoline prices. Nationally prices are at $3.55 per gallon. A year ago, prices were at $3.55 per gallon, so gasoline prices are unchanged year-over-year.


