 RSS Feed
 by Calculated Risk on 5/30/2024 08:09:00 PM
Thursday, May 30, 2024
Friday: Personal Income and Outlays
 Note: Mortgage rates are from MortgageNewsDaily.com and are for top tier scenarios.
Friday:
• At 8:30 AM ET, Personal Income and Outlays, April 2024. The consensus is for a 0.3% increase in personal income, and for a 0.3% increase in personal spending. And for the Core PCE price index to increase 0.3%. PCE prices are expected to be up 2.7% YoY, and core PCE prices up 2.8% YoY.
• At 9:45 AM, Chicago Purchasing Managers Index for May.
Realtor.com Reports Active Inventory Up 36.5% YoY; Most Homes For Sale Since July 2020
by Calculated Risk on 5/30/2024 02:35:00 PM
What this means: On a weekly basis, Realtor.com reports the year-over-year change in active inventory and new listings. On a monthly basis, they report total inventory. For April, Realtor.com reported inventory was up 30.4% YoY, but still down almost 36% compared to April 2017 to 2019 levels.
Now - on a weekly basis - inventory is up 36.5% YoY.
Realtor.com has monthly and weekly data on the existing home market. Here is their weekly report: Weekly Housing Trends View—Data for Week Ending May 25, 2024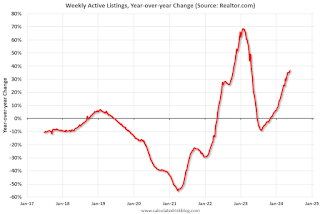 Here is a graph of the year-over-year change in inventory according to realtor.com.
Inventory was up year-over-year for the 29th consecutive week.
Realtor.com has monthly and weekly data on the existing home market. Here is their weekly report: Weekly Housing Trends View—Data for Week Ending May 25, 2024
• Active inventory increased, with for-sale homes 36.5% above year-ago levels.
For the 29th straight week, there were more homes listed for sale versus the prior year, giving homebuyers more options. This past week, the inventory of homes for sale grew by 36.5% compared with last year, and it was the highest since July 2020 in the early days of the COVID-19 Pandemic. This growth in inventory is primarily driven by housing markets in the South, which saw a 43.0% year-over-year increase in inventory in April.
• New listings–a measure of sellers putting homes up for sale–were up this week, by 3.6% from one year ago.
Seller activity continued to climb annually last week but decelerated relative to the previous week’s growth. Newly listed homes grew by 3.6% compared with a year ago, a slowdown from the 8.1% growth rate in the previous week.
 Here is a graph of the year-over-year change in inventory according to realtor.com.
 Inventory was up year-over-year for the 29th consecutive week.
However, inventory is still historically very low.
New listings remain below typical pre-pandemic levels although up year-over-year.
Final Look at Local Housing Markets in April and a Look Ahead to May Sales
by Calculated Risk on 5/30/2024 11:25:00 AM
Today, in the Calculated Risk Real Estate Newsletter: Final Look at Local Housing Markets in April and a Look Ahead to May Sales
A brief excerpt:
In April, sales in these markets were up 7.6% YoY. In March, these same markets were down 10.0% year-over-year Not Seasonally Adjusted (NSA).There is much more in the article.
Sales in most of these markets are down compared to January 2019. Sales in Grand Rapids and Nashville are up compared to 2019.
This is a year-over-year increase NSA for these markets. However, there were two more working days in April 2024 compared to April 2023, so sales Seasonally Adjusted were lower year-over-year than Not Seasonally Adjusted sales.
This was a 7.6% year-over-year decrease NSA for these markets. This is about the same as the 6.8% decline NSA reported by the NAR.
May sales will be mostly for contracts signed in March and April and mortgage rates increased slightly to an average of 6.99% in April. My early expectation is we will see a sales decrease in May on a seasonally adjusted annual rate basis (SAAR) compared to April.
Note for next month (May sales): There were the same number of working days in May 2024 compared to May 2023, so the year-over-year change in the seasonally adjusted sales will be about the same as the NSA data suggests.

NAR: Pending Home Sales Decrease 7.7% in April; Down 7.4% Year-over-year
by Calculated Risk on 5/30/2024 10:00:00 AM
From the NAR: Pending Home Sales Slumped 7.7% in April
Pending home sales in April fell 7.7%, according to the National Association of REALTORS®. All four U.S. regions registered month-over-month and year-over-year decreases.This was well below expectations. Note: Contract signings usually lead sales by about 45 to 60 days, so this would usually be for closed sales in May and June.
The Pending Home Sales Index (PHSI)* – a forward-looking indicator of home sales based on contract signings – decreased to 72.3 in April. Year over year, pending transactions were down 7.4%. An index of 100 is equal to the level of contract activity in 2001.
...
The Northeast PHSI fell 3.5% from last month to 62.9, a decline of 3.1% from April 2023. The Midwest index dropped 9.5% to 70.7 in April, down 8.7% from one year ago.
The South PHSI lowered 7.6% to 88.6 in April, dropping 8.2% from the prior year. The West index decreased 8.5% in April to 55.9, down 7.3% from April 2023.
emphasis added
Q1 GDP Growth Revised Down to 1.3% Annual Rate
by Calculated Risk on 5/30/2024 08:35:00 AM
From the BEA: Gross Domestic Product, First Quarter 2024 (Second Estimate) and Corporate Profits (Preliminary)
Real gross domestic product (GDP) increased at an annual rate of 1.3 percent in the first quarter of 2024, according to the "second" estimate released by the Bureau of Economic Analysis. In the fourth quarter of 2023, real GDP increased 3.4 percent.Here is a Comparison of Second and Advance Estimates. PCE growth was revised down from 2.5% to 2.0%. Residential investment was revised up from 13.9% to 15.4%.
The GDP estimate released today is based on more complete source data than were available for the "advance" estimate issued last month. In the advance estimate, the increase in real GDP was 1.6 percent. The update primarily reflected a downward revision to consumer spending (refer to "Updates to GDP").
The increase in real GDP primarily reflected increases in consumer spending, residential fixed investment, nonresidential fixed investment, and state and local government spending that were partly offset by a decrease in private inventory investment. Imports, which are a subtraction in the calculation of GDP, increased.
emphasis added
Weekly Initial Unemployment Claims Increase to 219,000
by Calculated Risk on 5/30/2024 08:30:00 AM
The DOL reported:
In the week ending May 25, the advance figure for seasonally adjusted initial claims was 219,000, an increase of 3,000 from the previous week's revised level. The previous week's level was revised up by 1,000 from 215,000 to 216,000. The 4-week moving average was 222,500, an increase of 2,500 from the previous week's revised average. The previous week's average was revised up by 250 from 219,750 to 220,000.The following graph shows the 4-week moving average of weekly claims since 1971.
emphasis added
 Click on graph for larger image.
The dashed line on the graph is the current 4-week average. The four-week average of weekly unemployment claims increased to 222,500.
The previous week was revised up.
Weekly claims were higher close to the consensus forecast.
Wednesday, May 29, 2024
Thursday: GDP, Unemployment Claims, Pending Home Sales
by Calculated Risk on 5/29/2024 08:02:00 PM
 Note: Mortgage rates are from MortgageNewsDaily.com and are for top tier scenarios.
Thursday:
• At 8:30 AM ET, The initial weekly unemployment claims report will be released. The consensus is for 218 thousand initial claims, up from 215 thousand last week.
• Also at 8:30 AM, Gross Domestic Product, 1st quarter 2023 (Second estimate). The consensus is that real GDP increased 1.2% annualized in Q1, down from the advance estimate of 1.6%.
• At 10:00 AM, Pending Home Sales Index for April. The consensus is for a 0.6% decrease in the index.
Las Vegas April 2024: Visitor Traffic Up 3.8% YoY; Convention Traffic Up 36%
by Calculated Risk on 5/29/2024 05:00:00 PM
From the Las Vegas Visitor Authority: April 2024 Las Vegas Visitor Statistics
With strength in both leisure and conventions segments, Las Vegas visitation in April exceeded 3.5M, up +3.8% YoY.
Convention attendance saw a YoY increase of 36% related in part to scheduling differences of some shows such as the ISC West ‐ International Security Conference (20K attendees, in Apr 2024 vs. Mar last year) along with new shows including the Google Cloud Next show (30k attendees), the Craft Brewers Conference (12k attendees) and the PZ3 Live Veterinary & Pet Technology Conference (5k attendees).
Even with a larger room count vs. last April, overall hotel occupancy reached 85.5% (up 1.2 pts), with Weekend occupancy of 93.4% (up 1.0 pts) and Midweek occupancy reaching 82.6% (up 1.7 pts) . ADR exceeded $182 while RevPAR approached $156, showing YoY increases of 6.6% and 8.1%, respectively.
emphasis added
 Click on graph for larger image.
 The first graph shows visitor traffic for 2019 (Black), 2020 (dark blue), 2021 (light blue), 2022 (light orange), 2023 (dark orange) and 2024 (red).
Visitor traffic was up 3.8% compared to last April. Visitor traffic was down 0.8% compared to the same month in 2019.
Year-to-date visitor traffic is up 0.7% compared to 2019.
The second graph shows convention traffic.

Convention traffic was up 36.3% compared to April 2023, and down 4.9% compared to April 2019. 
Year-to-date convention traffic is down 8.1% compared to 2019.
FDIC: Number of Problem Banks Increased in Q1 2024
by Calculated Risk on 5/29/2024 01:36:00 PM
The FDIC released the Quarterly Banking Profile for Q1 2024:
Reports from 4,568 commercial banks and savings institutions insured by the Federal Deposit Insurance Corporation (FDIC) report aggregate net income of $64.2 billion in first quarter 2024, an increase of $28.4 billion (79.5 percent) from the prior quarter. A large decline in noninterest expense because of several substantial, non-recurring items recognized by large banks in the prior quarter, as well as higher noninterest income and lower provision expenses this quarter, contributed to the quarterly increase. These and other financial results for first quarter 2024 are included in the FDIC’s latest Quarterly Banking Profile released today.
...
Asset Quality Metrics Remained Generally Favorable With the Exception of Material Deterioration in Credit Card and Commercial Real Estate (CRE) Portfolios: Loans that were 90 days or more past due or in nonaccrual status increased to 0.91 percent of total loans, up five basis points from the prior quarter and 16 basis points from the year-ago quarter. The quarterly increase was led by commercial and industrial loans and non-owner-occupied CRE loans. The noncurrent rate for non-owner occupied CRE loans of 1.59 percent is now at its highest level since fourth quarter 2013, driven by office portfolios at the largest banks. Despite the recent increases, the industry’s total noncurrent ratio remains 37 basis points below the pre-pandemic average of 1.28 percent.
emphasis added
 Click on graph for larger image.
From the FDIC:
The number of banks on the FDIC’s “Problem Bank List” increased from 52 to 63. Total assets held by problem banks rose $15.8 billion to $82.1 billion. Problem banks represent 1.4 percent of total banks, which is within the normal range for non-crisis periods of 1 to 2 percent of all banks.This graph from the FDIC shows the number of problem banks and assets at problem institutions.
Note: The number of assets for problem banks increased significantly back in 2018 when Deutsche Bank Trust Company Americas was added to the list. An even larger unknown bank was added to the list in Q4 2021, however that bank is now off the problem list.
It appears the recent increase in problem banks is related to office CRE loans.
Inflation Adjusted House Prices 2.2% Below Peak; Price-to-rent index is 7.5% below 2022 peak
by Calculated Risk on 5/29/2024 10:34:00 AM
Today, in the Calculated Risk Real Estate Newsletter: Inflation Adjusted House Prices 2.2% Below Peak
Excerpt:
It has been 18 years since the bubble peak. In the March Case-Shiller house price index released on Tuesday, the seasonally adjusted National Index (SA), was reported as being 72% above the bubble peak in 2006. However, in real terms, the National index (SA) is about 10% above the bubble peak (and historically there has been an upward slope to real house prices). The composite 20, in real terms, is 1% above the bubble peak.
People usually graph nominal house prices, but it is also important to look at prices in real terms. As an example, if a house price was $300,000 in January 2010, the price would be $431,000 today adjusted for inflation (44% increase). That is why the second graph below is important - this shows "real" prices.
The third graph shows the price-to-rent ratio, and the fourth graph is the affordability index. The last graph shows the 5-year real return based on the Case-Shiller National Index.
...
The second graph shows the same two indexes in real terms (adjusted for inflation using CPI).
In real terms (using CPI), the National index is 2.2% below the recent peak, and the Composite 20 index is 3.1% below the recent peak in 2022. Both indexes declined slightly in March in real terms.

There is much more in the article.


