by Calculated Risk on 6/04/2024 08:18:00 PM
Tuesday, June 04, 2024
Wednesday: ADP Employment, ISM Services

Wednesday:
• At 7:00 AM ET, The Mortgage Bankers Association (MBA) will release the results for the mortgage purchase applications index.
• At 8:15 AM, The ADP Employment Report for May. This report is for private payrolls only (no government). The consensus is for 174,000 payroll jobs added in May, down from 192,000 in April.
• At 10:00 AM, the ISM Services Index for May. The consensus is for a reading of 50.5, up from 59.4.
Heavy Truck Sales Unchanged in May
by Calculated Risk on 6/04/2024 02:13:00 PM
This graph shows heavy truck sales since 1967 using data from the BEA. The dashed line is the May 2024 seasonally adjusted annual sales rate (SAAR).
Heavy truck sales really collapsed during the great recession, falling to a low of 180 thousand SAAR in May 2009. Then heavy truck sales increased to a new record high of 570 thousand SAAR in April 2019.

Note: "Heavy trucks - trucks more than 14,000 pounds gross vehicle weight."
Heavy truck sales declined sharply at the beginning of the pandemic, falling to a low of 308 thousand SAAR in May 2020.
Asking Rents Mostly Unchanged Year-over-year
by Calculated Risk on 6/04/2024 10:39:00 AM
Today, in the Real Estate Newsletter: Asking Rents Mostly Unchanged Year-over-year
Brief excerpt:
Tracking rents is important for understanding the dynamics of the housing market. For example, the sharp increase in rents helped me deduce that there was a surge in household formation in 2021 (See from September 2021: Household Formation Drives Housing Demand). Now that household formation has slowed, and multi-family completions have increased, rents are under pressure.There is much more in the article.
From ApartmentList.com: Apartment List National Rent Report
The national median rent increased by 0.5% in May and now stands at $1,404, but the pace of growth slowed slightly this month. This is typically the time of year when rent growth is accelerating amid the busy moving season, so sluggish growth this month indicates that the market is headed for another slow summer.CoreLogic: “Attached Single-Family Rental Prices Post First Annual Decrease in 14 Years”
Since the second half of 2022, seasonal declines have been steeper than usual and seasonal increases have been more mild. As a result, apartments are on average slightly cheaper today than they were one year ago. Year-over-year rent growth nationally currently stands at -0.8 percent and has now been in negative territory since last summer.U.S. single-family rent growth continued to slowly increase year over year in March to 3.4%.
After registering a 2.9% annual gain in February, attached rental appreciation lost ground in March, posting a -0.6% loss.
BLS: Job Openings Decreased to 8.1 million in April
by Calculated Risk on 6/04/2024 10:00:00 AM
From the BLS: Job Openings and Labor Turnover Summary
The number of job openings changed little at 8.1 million on the last business day of April, the U.S. Bureau of Labor Statistics reported today. Over the month, both the number of hires and total separations were little changed at 5.6 million and 5.4 million, respectively. Within separations, quits (3.5 million) and layoffs and discharges (1.5 million) changed little.The following graph shows job openings (black line), hires (dark blue), Layoff, Discharges and other (red column), and Quits (light blue column) from the JOLTS.
emphasis added
This series started in December 2000.
Note: The difference between JOLTS hires and separations is similar to the CES (payroll survey) net jobs headline numbers. This report is for April; the employment report this Friday will be for May.
 Click on graph for larger image.
Note that hires (dark blue) and total separations (red and light blue columns stacked) are usually pretty close each month. This is a measure of labor market turnover. When the blue line is above the two stacked columns, the economy is adding net jobs - when it is below the columns, the economy is losing jobs.
The spike in layoffs and discharges in March 2020 is labeled, but off the chart to better show the usual data.
Jobs openings decreased in April to 8.06 million from 8.36 million in March.
The number of job openings (black) were down 19% year-over-year.
Quits were down 3% year-over-year. These are voluntary separations. (See light blue columns at bottom of graph for trend for "quits").
CoreLogic: US Home Prices Increased 5.3% Year-over-year in April
by Calculated Risk on 6/04/2024 08:00:00 AM
Notes: This CoreLogic House Price Index report is for April. The recent Case-Shiller index release was for March. The CoreLogic HPI is a three-month weighted average and is not seasonally adjusted (NSA).
From CoreLogic: CoreLogic: Monthly US Home Price Gains Dip Below Seasonal Average in April
• U.S. year-over-year single-family home price appreciation was 5.3% in April, the same as in March.This was the same YoY increase as reported for March, and down from the 5.8% YoY increase reported at the beginning of 2024.
• All states posted annual appreciation in March, led by New Hampshire (12%), New Jersey (11%) and South Dakota (10.8%).
• Of the 10 tracked major U.S. metro areas, San Diego (9.9%) overtook Miami (9.7%) for the top spot.
...
Annual U.S. home price appreciation remained above 5% in April, with three states posting double-digit gains. By next spring, national price gains are projected to slow to 3.4%, with only a few states putting up increases of higher than 6%. This slow cooling reflects not only the increasing number of homes on the market in some parts of the country, but also elevated, 30-year, fixed-rate mortgages, which remain around 7%, a major factor influencing America’s continuing housing affordability challenges.
“Home price growth continues to slow, as a comparison with a strong 2023 spring is still impacting year-over-year differences,” said Dr. Selma Hepp, chief economist for CoreLogic. “Nevertheless, the April uptick in mortgage rates to this year’s high has cooled some of the typical spring homebuyer demand, which pulled monthly gains of 1.1% below the March-to-April average.”
“The home price slowing also highlights buyers’ increased sensitivity to rising interest rates, as well as the anticipation that presumed lower rates down the road will help ease the affordability crunch,” Hepp continued. “Also, the price cooling is more pronounced in markets where there has been an influx of inventory and/or new construction, as well as those where additional homeownership costs (such as insurance, taxes and HOA fees) have risen relatively faster.”
emphasis added
Monday, June 03, 2024
Tuesday: Job Openings
by Calculated Risk on 6/03/2024 09:11:00 PM
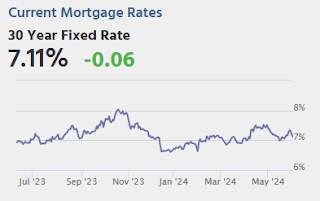
Sharp improvements in the bond market led to another nice drop in mortgage rates. The average lender is now back to the lowest levels in nearly 2 weeks, but not yet back to the recent lows seen on May 15th. [30 year fixed 7.11%]Tuesday:
emphasis added
• At 10:00 AM ET, Job Openings and Labor Turnover Survey for April from the BLS.
Vehicles Sales Increase to 15.9 million SAAR in May; Up 2.5% YoY
by Calculated Risk on 6/03/2024 06:55:00 PM
Wards Auto released their estimate of light vehicle sales for May: May U.S. Light-Vehicle Sales Continue 2024 Trend of Slow, Steady Growth (pay site).
Further confirming as a theme for 2024, growth in May largely was centered in the most affordable CUV and car segments. Other sectors during the first five months of 2024 have either recorded sporadic gains or fell into steady decline, including some, such as fullsize pickups, that are coming off lengthy periods of strong results. So far in 2024, market strength is with more affordable small and midsize CUVs and small sedans.
 Click on graph for larger image.
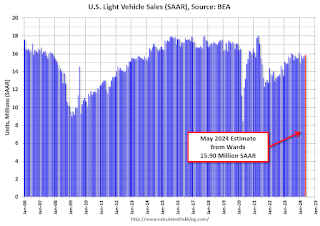
This graph shows light vehicle sales since 2006 from the BEA (blue) and Wards Auto's estimate for May (red).
Sales in May (15.90 million SAAR) were up 1.0% from April, and up 2.5% from May 2023.
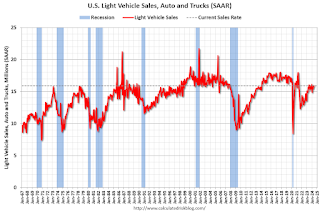 Sales in May were at the consensus forecast.
Freddie Mac House Price Index Increased in April; Up 6.5% Year-over-year
by Calculated Risk on 6/03/2024 01:17:00 PM
Today, in the Calculated Risk Real Estate Newsletter: Freddie Mac House Price Index Increased in April; Up 6.5% Year-over-year
A brief excerpt:
On a year-over-year basis, the National FMHPI was up 6.5% in April, down from up 6.6% YoY in March. The YoY increase peaked at 19.1% in July 2021, and for this cycle, bottomed at up 0.9% YoY in April 2023. ...
As of April, 9 states and D.C. were below their previous peaks, Seasonally Adjusted. The largest seasonally adjusted declines from the recent peak were in Idaho (-2.1%), Hawaii (-1.4%), Utah (-1.1%), and D.C. (-1.1%).
For cities (Core-based Statistical Areas, CBSA), here are the 30 cities with the largest declines from the peak, seasonally adjusted. Austin continues to be the worst performing city.
ICE Mortgage Monitor: "Home Prices Cool for Second Straight Month in April"
by Calculated Risk on 6/03/2024 10:20:00 AM
Today, in the Real Estate Newsletter: ICE Mortgage Monitor: "Home Prices Cool for Second Straight Month in April"
Brief excerpt:
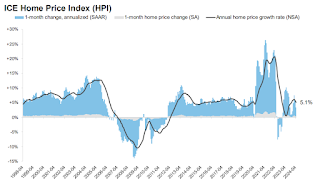
Press Release: ICE Mortgage Monitor: Home Prices Cool for Second Straight Month in April as Purchase Demand Softens, Inventory Deficits ImproveThere is much more in the article.Here is the year-over-year in house prices according to the ICE Home Price Index (HPI). The ICE HPI is a repeat sales index. Black Knight reports the median price change of the repeat sales. The index was up 5.1% year-over-year in April, down from 5.7% YoY in March.
• Home price growth cooled for the second straight month in April as elevated interest rates resulted in softer demand and improved inventory
▪ The annual home price growth rate cooled to 5.1% from a revised 5.7% in March, and as high as 6.1% back in February
▪ Unadjusted prices rose by 0.88% in the month, falling slightly below their -year same-month average for the first time this year
▪ Adjusted for seasonality, prices rose by 0.28% in the month (down from 0.45% in March), equivalent to a 3.4% seasonally adjusted annualized rate SAAR, suggesting annual home price gains will continue to ease in coming months
▪ If adjusted monthly gains continue at their current pace, annual home price growth would be below 4.25% by June and below 4% by July
Construction Spending Decreased 0.1% in April
by Calculated Risk on 6/03/2024 10:18:00 AM
From the Census Bureau reported that overall construction spending decreased:
Construction spending during April 2024 was estimated at a seasonally adjusted annual rate of $2,099.0 billion, 0.1 percent below the revised March estimate of $2,101.5 billion. The April figure is 10.0 percent (±1.5 percent) above the April 2023 estimate of $1,907.8 billion.Private and public spending decreased:
emphasis added
Spending on private construction was at a seasonally adjusted annual rate of $1,611.9 billion, 0.1 percent below the revised March estimate of $1,613.3 billion. ...
In April, the estimated seasonally adjusted annual rate of public construction spending was $487.1 billion, 0.2 percent below the revised March estimate of $488.2 billion.
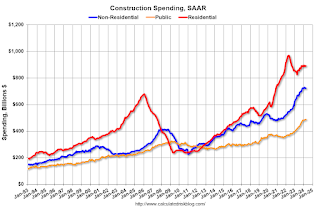 Click on graph for larger image.
This graph shows private residential and nonresidential construction spending, and public spending, since 1993. Note: nominal dollars, not inflation adjusted.
Residential (red) spending is 8.2% below the recent peak in 2022.
Non-residential (blue) spending is 1.0% below the peak two months ago.
Public construction spending is 0.2% below the peak last month.
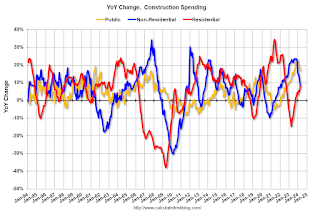 The second graph shows the year-over-year change in construction spending.
On a year-over-year basis, private residential construction spending is up 8.0%. Non-residential spending is up 8.3% year-over-year. Public spending is up 16.8% year-over-year.

