 RSS Feed
 by Calculated Risk on 6/24/2024 04:07:00 PM
Monday, June 24, 2024
MBA Survey: Share of Mortgage Loans in Forbearance Decreases Slightly to 0.21% in May
From the MBA: Share of Mortgage Loans in Forbearance Decreases Slightly to 0.21% in May
The Mortgage Bankers Association’s (MBA) monthly Loan Monitoring Survey revealed that the total number of loans now in forbearance declined slightly to 0.21% as of May 31, 2024. According to MBA’s estimate, 105,000 homeowners are in forbearance plans. Mortgage servicers have provided forbearance to approximately 8.2 million borrowers since March 2020.At the end of May, there were about 105,000 homeowners in forbearance plans.
In May 2024, the share of Fannie Mae and Freddie Mac loans in forbearance declined 1 basis point to 0.10%. Ginnie Mae loans in forbearance remained the same relative to the previous month at 0.39%, and the forbearance share for portfolio loans and private-label securities (PLS) also stayed flat at 0.31%.
“The performance of servicing portfolios in May was solid, with about 96 percent of borrowers making their mortgage payments on time,” said Marina Walsh, CMB, MBA’s Vice President of Industry Analysis. “There was a slight decline in the performance of post-forbearance loan workouts, but the results were relatively strong with 75 percent of homeowners making their payments in accordance with the workout terms.”
emphasis added
Watch Months-of-Supply!
by Calculated Risk on 6/24/2024 10:50:00 AM
Today, in the Calculated Risk Real Estate Newsletter: Watch Months-of-Supply!
A brief excerpt:
Although inventory is well below normal levels, so are sales. I think we need to keep an eye on months-of-supply. Historically nominal prices declined when months-of-supply approached 6 months - and that is unlikely this year - but we could see months-of-supply back to 2019 levels later this year.There is much more in the article.
What would it take to get months-of-supply back to 2019 levels by mid-year? The following table is a simple exercise. If sales stay depressed at 2023 levels, how much would inventory have to increase to put months-of-supply at 2019 levels?
Housing June 24th Weekly Update: Inventory up 2.2% Week-over-week, Up 37.7% Year-over-year
by Calculated Risk on 6/24/2024 08:12:00 AM
Altos reports that active single-family inventory was up 2.2% week-over-week. Inventory is now up 28.4% from the February seasonal bottom, and at the highest level since July 2020.
 Click on graph for larger image.
This inventory graph is courtesy of Altos Research.
As of June 21st, inventory was at 634 thousand (7-day average), compared to 621 thousand the prior week.
Inventory is still far below pre-pandemic levels.

The red line is for 2024. The black line is for 2019. Note that inventory is up 80% from the record low for the same week in 2021, but still well below normal levels.
Inventory was up 37.7% compared to the same week in 2023 (last week it was up 37.3%), and down 33.6% compared to the same week in 2019 (last week it was down 34.2%).
Inventory should be above 2020 levels for the same week in a few weeks.
Back in June 2023, inventory was down almost 54% compared to 2019, so the gap to more normal inventory levels is slowly closing.
Mike Simonsen discusses this data regularly on Youtube.
Sunday, June 23, 2024
Sunday Night Futures
by Calculated Risk on 6/23/2024 06:36:00 PM
Weekend:
• Schedule for Week of June 23, 2024
Monday:
• At 10:30 AM ET, Dallas Fed Survey of Manufacturing Activity for June.
From CNBC: Pre-Market Data and Bloomberg futures S&P 500 and DOW futures are little changed (fair value).
Oil prices were up over the last week with WTI futures at $80.73 per barrel and Brent at $85.24 per barrel. A year ago, WTI was at $69, and Brent was at $74 - so WTI oil prices are up about 17% year-over-year.
Here is a graph from Gasbuddy.com for nationwide gasoline prices. Nationally prices are at $3.42 per gallon. A year ago, prices were at $3.56 per gallon, so gasoline prices are down $0.14 year-over-year.
Hotels: Occupancy Rate Decreased 0.6% Year-over-year
by Calculated Risk on 6/23/2024 01:04:00 PM
The U.S. hotel industry reported higher performance results from the previous week but mixed comparisons year over year, according to CoStar’s latest data through 15 June. ...The following graph shows the seasonal pattern for the hotel occupancy rate using the four-week average.
9-15 June 2024 (percentage change from comparable week in 2023):
• Occupancy: 70.3% (-0.6%)
• Average daily rate (ADR): US$161.70 (+0.9%)
• Revenue per available room (RevPAR): US$113.62 (+0.3%)
emphasis added
 Click on graph for larger image.
The red line is for 2024, blue is the median, and dashed light blue is for 2023. Dashed purple is for 2018, the record year for hotel occupancy.
The 4-week average of the occupancy rate is tracking last year and is slightly above the median rate for the period 2000 through 2023 (Blue).
Note: Y-axis doesn't start at zero to better show the seasonal change.
The 4-week average of the occupancy rate will now increase seasonally with the summer travel season.
Saturday, June 22, 2024
Real Estate Newsletter Articles this Week: Single Family Starts Down Slightly Year-over-year in May; Multi-Family Starts Down 50%
by Calculated Risk on 6/22/2024 02:11:00 PM
At the Calculated Risk Real Estate Newsletter this week:
 Click on graph for larger image.
• Single Family Starts Down Slightly Year-over-year in May; Multi-Family Starts Down 50%
• NAR: Existing-Home Sales Decreased to 4.11 million SAAR in May
• Lawler: Early Read on Existing Home Sales in May
• 4th Look at Local Housing Markets in May; California Home Sales Down 6% YoY in May
• Comparing the Current Housing Market to the 1978 to 1982 period
This is usually published 4 to 6 times a week and provides more in-depth analysis of the housing market.
Schedule for Week of June 23, 2024
by Calculated Risk on 6/22/2024 08:11:00 AM
The key reports this week are May New Home sales, the third estimate of Q1 GDP, Personal Income and Outlays for May and the April Case-Shiller house price index.
For manufacturing, the June Dallas, Kansas City and Richmond Fed manufacturing surveys will be released.
10:30 AM: Dallas Fed Survey of Manufacturing Activity for June.
8:30 AM ET: Chicago Fed National Activity Index for May. This is a composite index of other data.
 9:00 AM: S&P/Case-Shiller House Price Index for April.
This graph shows the year-over-year change in the seasonally adjusted National Index, Composite 10 and Composite 20 indexes through the most recent report (the Composite 20 was started in January 2000).
The National index was up 6.5% year-over-year in March.
9:00 AM: FHFA House Price Index for April. This was originally a GSE only repeat sales, however there is also an expanded index.
10:00 AM: Richmond Fed Survey of Manufacturing Activity for June.
10:00 AM: State Employment and Unemployment (Monthly) for May 2024.
7:00 AM ET: The Mortgage Bankers Association (MBA) will release the results for the mortgage purchase applications index.
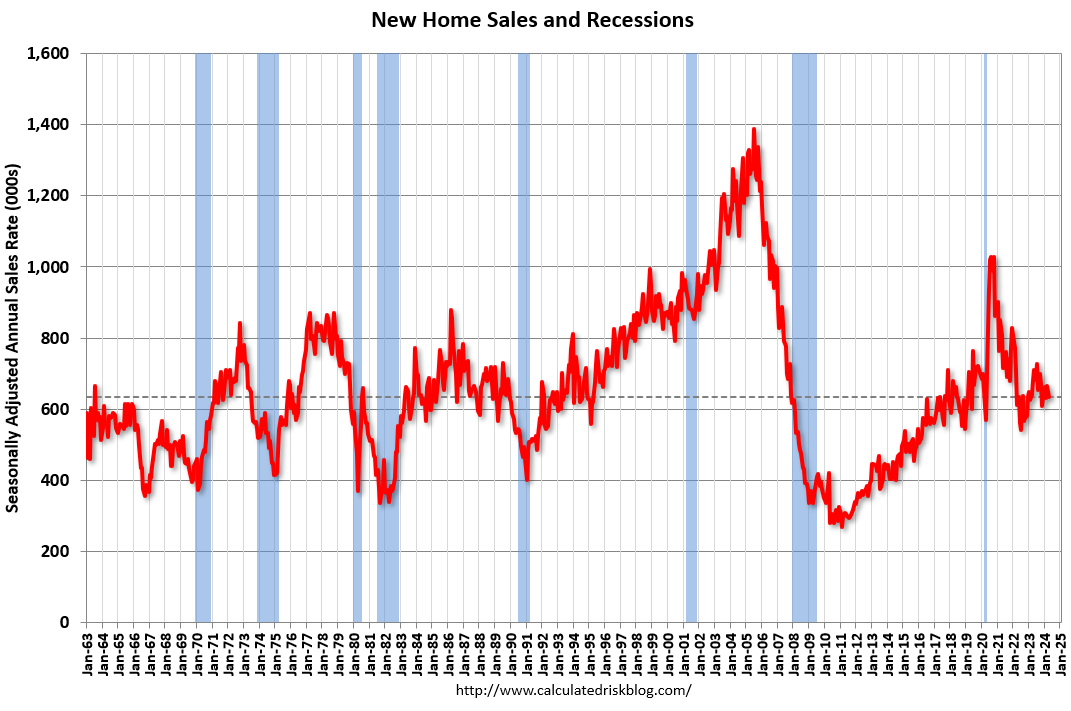 10:00 AM: New Home Sales for May from the Census Bureau.
 This graph shows New Home Sales since 1963. The dashed line is the sales rate for last month.
The consensus is for 650 thousand SAAR, up from 634 thousand in April.
During the day: The AIA's Architecture Billings Index for May (a leading indicator for commercial real estate).
8:30 AM: The initial weekly unemployment claims report will be released. The consensus is for 240 thousand initial claims, up from 238 thousand last week.
8:30 AM: Gross Domestic Product, 1st quarter 2024 (Third estimate). The consensus is that real GDP increased 1.3% annualized in Q1, unchanged from the second estimate of a 1.3% increase.
8:30 AM: Durable Goods Orders for May from the Census Bureau. The consensus is for a 0.3% increase in durable goods orders.
10:00 AM: Pending Home Sales Index for May. The consensus is for a 0.3% decrease in the index.
11:00 AM: the Kansas City Fed manufacturing survey for June.
8:30 AM ET: Personal Income and Outlays, May 2024. The consensus is for a 0.4% increase in personal income, and for a 0.3% increase in personal spending.
9:45 AM: Chicago Purchasing Managers Index for June.
10:00 AM: University of Michigan's Consumer sentiment index (Final for June).
Friday, June 21, 2024
June 21st COVID Update: Wastewater Measure Increasing
by Calculated Risk on 6/21/2024 07:02:00 PM
 Note: Mortgage rates are from MortgageNewsDaily.com and are for top tier scenarios.
For deaths, I'm currently using 4 weeks ago for "now", since the most recent three weeks will be revised significantly.
Note: "Effective May 1, 2024, hospitals are no longer required to report COVID-19 hospital admissions, hospital capacity, or hospital occupancy data." So I'm no longer tracking hospitalizations, however hospitalizations were at a pandemic low three weeks ago.
| COVID Metrics | ||||
|---|---|---|---|---|
| Now | Week Ago | Goal | ||
| Deaths per Week✅ | 316 | 316 | ≤3501 | |
| 1my goals to stop weekly posts, 🚩 Increasing number weekly for Deaths ✅ Goal met. | ||||
 Click on graph for larger image.
This graph shows the weekly (columns) number of deaths reported.
Weekly deaths have declined from the recent peak of 2,561 and are now below the previous pandemic low of 491 last July. This week was at the pandemic low.
 This appears to be a leading indicator for COVID hospitalizations and deaths.
COVID in wastewater is increasing - especially in the West - and this suggest weekly deaths likely start increasing again.
Q2 GDP Tracking: 1.8% to 3.0%
by Calculated Risk on 6/21/2024 02:36:00 PM
From BofA:
Our 2Q tracking estimate is two tenths higher at 1.8% q/q saar largely due to stronger than expected May payrolls and weaker than expected May CPI and PPI [June 20th estimate]From Goldman:
emphasis added
We lowered our Q2 GDP tracking estimate by 0.1pp to +1.9% (qoq ar) and our Q2 domestic final sales forecast by the same amount to +2.0%. [June 20th estimate]And from the Altanta Fed: GDPNow
The GDPNow model estimate for real GDP growth (seasonally adjusted annual rate) in the second quarter of 2024 is 3.0 percent on June 20, down from 3.1 percent on June 18. After this morning's housing starts report from the US Census Bureau, the nowcast of second-quarter real gross private domestic investment growth decreased from 8.8 percent to 8.3 percent. [June 18th estimate]
NAR: Existing-Home Sales Decreased to 4.11 million SAAR in May; Median House Prices Increased 5.8% Year-over-Year
by Calculated Risk on 6/21/2024 10:48:00 AM
Today, in the CalculatedRisk Real Estate Newsletter: NAR: Existing-Home Sales Decreased to 4.11 million SAAR in May
Excerpt:
Sales Year-over-Year and Not Seasonally Adjusted (NSA)There is much more in the article.
The fourth graph shows existing home sales by month for 2023 and 2024.
Sales declined 2.8% year-over-year compared to May 2023. This was the thirty-third consecutive month with sales down year-over-year.


