by Calculated Risk on 6/30/2024 08:21:00 AM
Sunday, June 30, 2024
Hotels: Occupancy Rate Decreased 2.5% Year-over-year
The U.S. hotel industry reported lower performance results from the previous week and mixed comparisons year over year, according to CoStar’s latest data through 22 June. ...The following graph shows the seasonal pattern for the hotel occupancy rate using the four-week average.
16-22 June 2024 (percentage change from comparable week in 2023):
• Occupancy: 69.5% (-2.5%)
• Average daily rate (ADR): US$159.88 (+0.1%)
• Revenue per available room (RevPAR): US$111.17 (-2.3%)
emphasis added
 Click on graph for larger image.
The red line is for 2024, blue is the median, and dashed light blue is for 2023. Dashed purple is for 2018, the record year for hotel occupancy.
Saturday, June 29, 2024
Real Estate Newsletter Articles this Week: New Home Sales Decrease to 619,000 Annual Rate in May
by Calculated Risk on 6/29/2024 02:11:00 PM
At the Calculated Risk Real Estate Newsletter this week:

• New Home Sales Decrease to 619,000 Annual Rate in May
• Case-Shiller: National House Price Index Up 6.3% year-over-year in April
• Inflation Adjusted House Prices 2.3% Below Peak
• Watch Months-of-Supply!
• Freddie Mac House Price Index Increased in May; Up 5.9% Year-over-year
This is usually published 4 to 6 times a week and provides more in-depth analysis of the housing market.
Schedule for Week of June 30, 2024
by Calculated Risk on 6/29/2024 08:11:00 AM
The key report scheduled for this week is the June employment report to be released on Friday.
Other key reports include the June ISM Manufacturing survey, June Vehicle Sales and the Trade Deficit for May.
10:00 AM: ISM Manufacturing Index for June. The consensus is for the ISM to be at 49.0, up from 48.7 in May.
10:00 AM: Construction Spending for May. The consensus is for a 0.3% increase in construction spending.
9:30 AM: Discussion, Fed Chair Jerome Powell, Policy Panel Discussion, At the European Central Bank (ECB) Forum on Central Banking 2024, Sintra, Portugal
 10:00 AM ET: Job Openings and Labor Turnover Survey for May from the BLS.
 This graph shows job openings (black line), hires (dark blue), Layoff, Discharges and other (red column), and Quits (light blue column) from the JOLTS.
Jobs openings decreased in April to 8.06 million from 8.36 million in March.
The number of job openings (yellow) were down 19% year-over-year and quits were down 3% year-over-year.
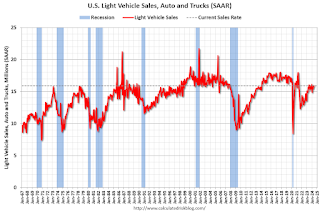
 Late in the day: Light vehicle sales for June.
The consensus is for light vehicle sales to be 15.9 million SAAR in June, unchanged from 15.9 million in May (Seasonally Adjusted Annual Rate).
This graph shows light vehicle sales since the BEA started keeping data in 1967. The dashed line is the sales rate for last month.
Wards Auto is forecasting sales of 15.9 million SAAR in June.
7:00 AM ET: The Mortgage Bankers Association (MBA) will release the results for the mortgage purchase applications index.
8:15 AM: The ADP Employment Report for June. This report is for private payrolls only (no government). The consensus is for 170,000 payroll jobs added in June, up from 152,000 in May.
8:30 AM: The initial weekly unemployment claims report will be released. The consensus is for 228 thousand initial claims, down from 233 thousand last week.
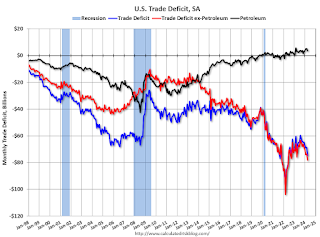
 8:30 AM: Trade Balance report for May from the Census Bureau.
 This graph shows the U.S. trade deficit, with and without petroleum, through the most recent report. The blue line is the total deficit, and the black line is the petroleum deficit, and the red line is the trade deficit ex-petroleum products.
The consensus is the trade deficit to be $72.2 billion. The U.S. trade deficit was at $74.6 billion the previous month.
10:00 AM: the ISM Services Index for June. The consensus is for a reading of 52.5, down from 53.8.
2:00 PM: FOMC Minutes, Meeting of June 11-12, 2024
US markets will close at 1:00 PM ET prior to the Independence Day Holiday.
All US markets will be closed in observance of Independence Day
 8:30 AM: Employment Report for June. The consensus is for 180,000 jobs added, and for the unemployment rate to be unchanged at 4.0%.
There were 272,000 jobs added in May, and the unemployment rate was at 4.0%.
This graph shows the jobs added per month since January 2021.
Friday, June 28, 2024
June 28th COVID Update: Wastewater Measure Increasing Sharply
by Calculated Risk on 6/28/2024 07:11:00 PM

| COVID Metrics | ||||
|---|---|---|---|---|
| Now | Week Ago | Goal | ||
| Deaths per Week✅ | 300 | 329 | ≤3501 | |
| 1my goals to stop weekly posts, 🚩 Increasing number weekly for Deaths ✅ Goal met. | ||||
 Click on graph for larger image.
This graph shows the weekly (columns) number of deaths reported.
 This appears to be a leading indicator for COVID hospitalizations and deaths.
Freddie Mac House Price Index Increased in May; Up 5.9% Year-over-year
by Calculated Risk on 6/28/2024 01:41:00 PM
Today, in the Calculated Risk Real Estate Newsletter: Freddie Mac House Price Index Increased in May; Up 5.9% Year-over-year
A brief excerpt:
On a year-over-year basis, the National FMHPI was up 5.9% in May, down from up 6.4% YoY in April. The YoY increase peaked at 19.1% in July 2021, and for this cycle, bottomed at up 0.9% YoY in April 2023. ...
As of May, 15 states and D.C. were below their previous peaks, Seasonally Adjusted. The largest seasonally adjusted declines from the recent peak were in Idaho (-4.0%), Montana (-2.8%), Wyoming (-1.7%), D.C. (-1.7%), Utah (-1.3%), and Florida (-1.2%).
For cities (Core-based Statistical Areas, CBSA), here are the 30 cities with the largest declines from the peak, seasonally adjusted. Austin continues to be the worst performing city.
Q2 GDP Tracking: 1.7% to 2.2%
by Calculated Risk on 6/28/2024 11:07:00 AM
From BofA:
Since our last weekly publication, 2Q GDP tracking is down from 1.8% q/q saar to 1.7% q/q saar and 1Q GDP came in at 1.4% in the third print. Here is a rundown of changes to our tracking estimate. [June 28th estimate]From Goldman:
emphasis added
We left our Q2 GDP tracking estimate unchanged on net at +1.9% (qoq ar) and lowered our Q2 domestic final sales forecast by 0.4pp to +1.6%. [June 28th estimate]And from the Altanta Fed: GDPNow
The GDPNow model estimate for real GDP growth (seasonally adjusted annual rate) in the second quarter of 2024 is 2.2 percent on June 28, down from 2.7 percent on June 27. After this morning's personal income and outlays release from the U.S. Bureau of Economic Analysis , the nowcasts of second-quarter real personal consumption expenditures growth and second-quarter real gross private domestic investment growth decreased from 2.5 percent and 8.8 percent, respectively, to 1.8 percent and 8.7 percent. [June 28th estimate]
PCE Measure of Shelter Slows to 5.5% YoY in May
by Calculated Risk on 6/28/2024 08:57:00 AM
Here is a graph of the year-over-year change in shelter from the CPI report and housing from the PCE report this morning, both through May 2024.

Since asking rents are mostly flat year-over-year, these measures will slowly continue to decline over the next year.
 The second graph shows PCE prices, Core PCE prices and Core ex-housing over the last 3 months (annualized):
Key measures are slightly above the Fed's target on a 3-month basis. Note: There appears to be some residual seasonality distorting PCE prices in Q1, especially in January.
PCE Price Index: 2.4% (3 month annualized)
Core PCE Prices: 2.7%
Core minus Housing: 2.2%
Personal Income increased 0.5% in May; Spending increased 0.2%
by Calculated Risk on 6/28/2024 08:30:00 AM
The BEA released the Personal Income and Outlays report for May:
Personal income income increased $114.1 billion (0.5 percent at a monthly rate) in May, according to estimates released today by the Bureau of Economic Analysis. Disposable personal income (DPI), personal income less personal current taxes, increased $94.0 billion (0.5 percent) and personal consumption expenditures (PCE) increased $47.8 billion (0.2 percent).The May PCE price index increased 2.6 percent year-over-year (YoY), down from 2.7 percent YoY in April, and down from the recent peak of 7.0 percent in June 2022.
The PCE price index decreased less than 0.1 percent. Excluding food and energy, the PCE price index increased 0.1 percent. Real DPI increased 0.5 percent in May and real PCE increased 0.3 percent; goods increased 0.6 percent and services increased 0.1 percent.
emphasis added
The following graph shows real Personal Consumption Expenditures (PCE) through May 2024 (2017 dollars). Note that the y-axis doesn't start at zero to better show the change.
 Click on graph for larger image.
The dashed red lines are the quarterly levels for real PCE.
Personal income was above expectations, and PCE was below expectations.
Using the two-month method to estimate Q2 real PCE growth, real PCE was increasing at a 1.8% annual rate in Q2 2024. (Using the mid-month method, real PCE was increasing at 1.8%). This suggests decent PCE growth in Q2.
Thursday, June 27, 2024
Friday: Personal Income & Outlays, Chicago PMI
by Calculated Risk on 6/27/2024 08:34:00 PM

Friday:
• At 8:30 AM ET, Personal Income and Outlays, May 2024. The consensus is for a 0.4% increase in personal income, and for a 0.3% increase in personal spending.
• At 9:45 AM: Chicago Purchasing Managers Index for June.
• At 10:00 AM: University of Michigan's Consumer sentiment index (Final for June).
Las Vegas May 2024: Visitor Traffic Up 4.6% YoY; Convention Traffic Up 2%
by Calculated Risk on 6/27/2024 04:32:00 PM
From the Las Vegas Visitor Authority: May 2024 Las Vegas Visitor Statistics
With festivals such as EDC, coupled with convention attendance ahead of last year, May saw the destination host more than 3.6M visitors, showing a healthy 4.6% YoY gain for the month.
Among the churn of rotational shows, Waste Expo returned to Las Vegas in May (14k attendees, last here in May 2022), and the destination hosted the Advanced Clean Transportation (ACT) Expo for the first time (10k+ attendees).
Overall hotel occupancy reached 86.1% (up 1.7 pts), as Weekend occupancy reached 93.4% (up 0.2 pts) and Midweek occupancy reaching 82.5% (up 1.7 pts). ADR exceeded $200 with RevPAR over $172, showing YoY increases of 9.1% and 11.3%, respectively.
emphasis added
 Click on graph for larger image.
 The first graph shows visitor traffic for 2019 (Black), 2020 (dark blue), 2021 (light blue), 2022 (light orange), 2023 (dark orange) and 2024 (red).
Visitor traffic was up 4.6% compared to last May. Visitor traffic was down 0.9% compared to the same month in 2019.


