 RSS Feed
 by Calculated Risk on 7/17/2024 02:00:00 PM
Wednesday, July 17, 2024
Fed's Beige Book: "Slight to modest pace of growth"
Economic activity maintained a slight to modest pace of growth in a majority of Districts this reporting cycle. However, while seven Districts reported some level of increase in activity, five noted flat or declining activity—three more than in the prior reporting period. Wages continued to grow at a modest to moderate pace in most Districts, while prices were generally reported to have risen modestly. Household spending was little changed this period according to most District banks. Auto sales varied across Districts this cycle, but some Districts noted that sales were lower due in part to a cyberattack on dealerships and high interest rates. Most Districts saw soft demand for consumer and business loans. Reports on residential and commercial real estate markets varied, but most banks reported only slight changes, if any, in recent weeks. Travel and tourism grew steadily and was on par with seasonal expectations. Agricultural conditions varied in tandem with sporadic droughts across the nation. Districts also reported widely disparate trends in manufacturing activity ranging from brisk downturn to moderate growth. Retail restocking spurred slight growth in transportation activity. Meanwhile, tight capacity in ocean shipping led to a surge in spot rates. Expectations for the future of the economy were for slower growth over the next six months due to uncertainty around the upcoming election, domestic policy, geopolitical conflict, and inflation.
Labor Markets
On balance, employment rose at a slight pace in the most recent reporting period. Most Districts reported employment was flat or up slightly, while a few Districts reported modest employment growth. Several Districts reported declines in employment in the manufacturing sector due to slowdowns in new orders. Skilled-worker availability remained a challenge across all Districts; however, several Districts reported some improvement in labor supply conditions. Additionally, labor turnover was lower, which reduced demand to find new workers. Looking ahead, contacts in several Districts expect to be more selective on who they hire and not backfill all open positions. Wages grew at a modest to moderate pace in most Districts. However, several Districts reported some slowing of wage growth due to increased worker availability and less competition for workers.
Prices
Prices increased at a modest pace overall, with a couple Districts noting only slight increases.
emphasis added
Single Family Starts Up Year-over-year in June; Multi-Family Starts Down 23% YoY
by Calculated Risk on 7/17/2024 09:39:00 AM
Today, in the Calculated Risk Real Estate Newsletter: Single Family Starts Up Year-over-year in June; Multi-Family Starts Down 23% YoY
A brief excerpt:
Total housing starts in June were above expectations and starts in April and May were revised up.There is much more in the article.
The third graph shows the month-to-month comparison for total starts between 2023 (blue) and 2024 (red).
Total starts were down 4.4% in June compared to June 2023.
The YoY decline in total starts was due to the sharp YoY decrease in multi-family starts. Single family starts have been up YoY for 12 consecutive months.

Industrial Production Increased 0.6% in June
by Calculated Risk on 7/17/2024 09:15:00 AM
From the Fed: Industrial Production and Capacity Utilization
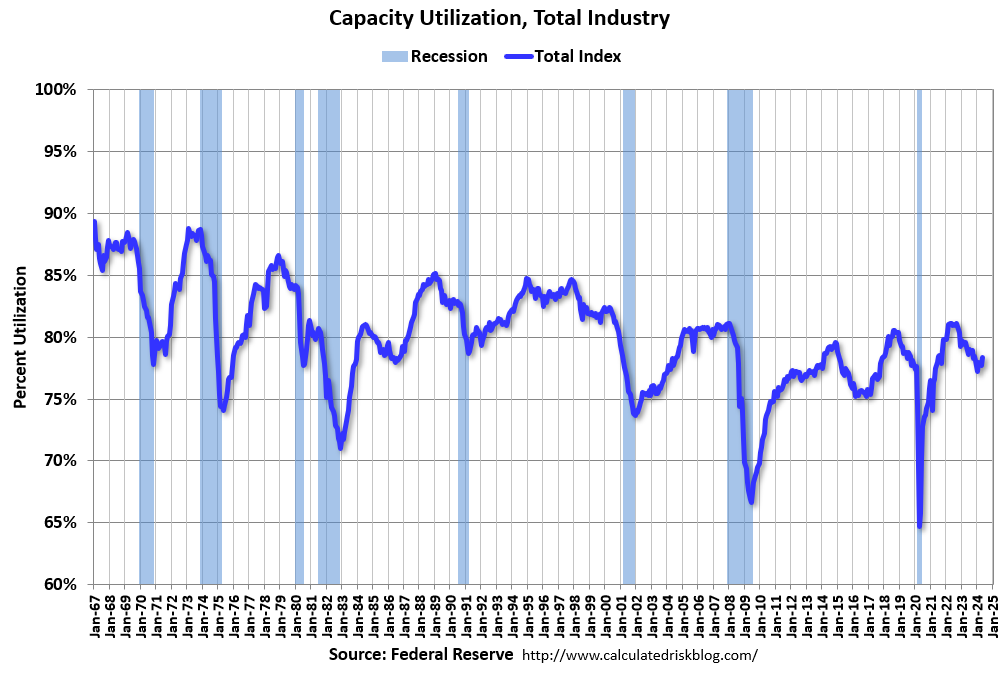
Industrial production rose 0.6 percent in June after advancing 0.9 percent in May. For the second quarter as a whole, industrial production increased at an annual rate of 4.3 percent. Manufacturing output moved up 0.4 percent in June and rose 3.4 percent (annual rate) in the second quarter. In June, the indexes for mining and utilities posted gains of 0.3 percent and 2.8 percent, respectively. At 104 percent of its 2017 average, total industrial production in June was 1.6 percent above its year-earlier level. Capacity utilization moved up to 78.8 percent in June, a rate that is 0.9 percentage point below its long-run (1972–2023) average.
emphasis added
 Click on graph for larger image.
This graph shows Capacity Utilization. This series is up from the record low set in April 2020, and above the level in February 2020 (pre-pandemic).
Capacity utilization at 78.8% is 0.9% below the average from 1972 to 2022. This was above consensus expectations.
Note: y-axis doesn't start at zero to better show the change.
 The second graph shows industrial production since 1967.
Industrial production increased to 104.0. This is above the pre-pandemic level.
Industrial production was above consensus expectations.
Housing Starts Increased to 1.353 million Annual Rate in June
by Calculated Risk on 7/17/2024 08:30:00 AM
From the Census Bureau: Permits, Starts and Completions
Housing Starts:
Privately-owned housing starts in June were at a seasonally adjusted annual rate of 1,353,000. This is 3.0 percent above the revised May estimate of 1,314,000, but is 4.4 percent below the June 2023 rate of 1,415,000. Single-family housing starts in June were at a rate of 980,000; this is 2.2 percent below the revised May figure of 1,002,000. The June rate for units in buildings with five units or more was 360,000.
Building Permits:
Privately-owned housing units authorized by building permits in June were at a seasonally adjusted annual rate of 1,446,000. This is 3.4 percent above the revised May rate of 1,399,000, but is 3.1 percent below the June 2023 rate of 1,493,000. Single-family authorizations in June were at a rate of 934,000; this is 2.3 percent below the revised May figure of 956,000. Authorizations of units in buildings with five units or more were at a rate of 460,000 in June.
emphasis added
 Click on graph for larger image.
The first graph shows single and multi-family housing starts since 2000.
Multi-family starts (blue, 2+ units) increased in June compared to May. Multi-family starts were down 23.1% year-over-year.
Single-family starts (red) decreased in June and were up 5.4% year-over-year.
 The second graph shows single and multi-family housing starts since 1968.
 This shows the huge collapse following the housing bubble, and then the eventual recovery - and the recent collapse and recovery in single-family starts.
Total housing starts in June were above expectations, and starts in April and May were revised up.
I'll have more later …
MBA: Mortgage Applications Increased in Weekly Survey
by Calculated Risk on 7/17/2024 07:00:00 AM
From the MBA: Mortgage Applications Increase in Latest MBA Weekly Survey
Mortgage applications increased 3.9 percent from one week earlier, according to data from the Mortgage Bankers Association’s (MBA) Weekly Applications Survey for the week ending July 12, 2024.
The Market Composite Index, a measure of mortgage loan application volume, increased 3.9 percent on a seasonally adjusted basis from one week earlier. On an unadjusted basis, the Index increased 30 percent compared with the previous week. The Refinance Index increased 15 percent from the previous week and was 37 percent higher than the same week one year ago. The seasonally adjusted Purchase Index decreased 3 percent from one week earlier. The unadjusted Purchase Index increased 22 percent compared with the previous week and was 14 percent lower than the same week one year ago.
“Mortgage rates declined last week, as recent signs of cooling inflation and the increased likelihood of Fed rate cuts later this year pulled them lower. The 30-year fixed rate declined to 6.87 percent, the lowest rate since March 2024,” said Joel Kan, MBA’s Vice President and Deputy Chief Economist. “Application activity was up 4 percent, driven by a 15 percent jump in refinances to the highest level since August 2022. While FHA and VA refinance applications accounted for a significant share of the increase, these are likely recently originated loans with even higher than current offered rates. Even with last week’s rate decline, purchase applications continue to lag, down 14 percent compared to last year’s pace.”
...
The average contract interest rate for 30-year fixed-rate mortgages with conforming loan balances ($766,550 or less) decreased to 6.87 percent from 7.00 percent, with points decreasing to 0.57 from 0.60 (including the origination fee) for 80 percent loan-to-value ratio (LTV) loans.
emphasis added
 Click on graph for larger image.
The first graph shows the MBA mortgage purchase index.
According to the MBA, purchase activity is down 14% year-over-year unadjusted.
Red is a four-week average (blue is weekly).
Purchase application activity is up slightly from the lows in late October 2023, but still below the lowest levels during the housing bust.

The second graph shows the refinance index since 1990.
With higher mortgage rates, the refinance index declined sharply in 2022, and mostly flat lined since then with some increase recently.
Tuesday, July 16, 2024
Wednesday: Housing Starts, Industrial Production, Beige Book
by Calculated Risk on 7/16/2024 07:07:00 PM
 Note: Mortgage rates are from MortgageNewsDaily.com and are for top tier scenarios.
Wednesday:
• At 7:00 AM ET, The Mortgage Bankers Association (MBA) will release the results for the mortgage purchase applications index.
• At 8:30 AM, Housing Starts for June. The consensus is for 1.310 million SAAR, up from 1.277 million SAAR in May.
• At 9:15 AM, The Fed will release Industrial Production and Capacity Utilization for June. The consensus is for a 0.3% increase in Industrial Production, and for Capacity Utilization to increase to 78.6%.
• At 2:00 PM, the Federal Reserve Beige Book, an informal review by the Federal Reserve Banks of current economic conditions in their Districts.
3rd Look at Local Housing Markets in June
by Calculated Risk on 7/16/2024 12:34:00 PM
Today, in the Calculated Risk Real Estate Newsletter: 3rd Look at Local Housing Markets in June
A brief excerpt:
NOTE: The tables for active listings, new listings and closed sales all include a comparison to June 2019 for each local market (some 2019 data is not available).There is much more in the article.
This is the third look at several local markets in June. I’m tracking over 40 local housing markets in the US. Some of the 40 markets are states, and some are metropolitan areas. I’ll update these tables throughout the month as additional data is released.
Closed sales in June were mostly for contracts signed in April and May when 30-year mortgage rates averaged 6.99% and 7.06%, respectively (Freddie Mac PMMS). May was the first month since last Fall with average 30-year mortgage rates over 7%.
...
In June, sales in these markets were down 12.5% YoY. Last month, in May, these same markets were down 1.0% year-over-year Not Seasonally Adjusted (NSA).
...
This is a year-over-year decrease NSA for these early reporting markets. However, there were two fewer working days in June 2024 compared to June 2023 (19 vs 21), so seasonally adjusted sales will be much higher than the NSA data suggests.
...
More local markets to come!

NAHB: Builder Confidence Declined in July
by Calculated Risk on 7/16/2024 10:00:00 AM
The National Association of Home Builders (NAHB) reported the housing market index (HMI) was at 42, down from 43 last month. Any number below 50 indicates that more builders view sales conditions as poor than good.
From the NAHB: High Mortgage Rates Continue to Hold Back Builder Confidence
Mortgage rates that averaged 6.92% in June per Freddie Mac, along with elevated rates for construction and development loans, continue to put a damper on builder sentiment.
Builder confidence in the market for newly built single-family homes was 42 in July, down one point from June, according to the National Association of Home Builders (NAHB)/Wells Fargo Housing Market Index (HMI) released today. This is the lowest reading since December 2023.
“While buyers appear to be waiting for lower interest rates, the six-month sales expectation for builders moved higher, indicating that builders expect mortgage rates to edge lower later this year as inflation data are showing signs of easing,” said NAHB Chairman Carl Harris, a custom home builder from Wichita, Kan.
“Though inflation is still above the Federal Reserve’s target of 2%, it appears to be back on a cooling trend. NAHB is forecasting Fed rate reductions to begin at the end of this year, and this action will lower interest rates for home buyers, builders and developers,” said NAHB Chief Economist Robert Dietz. “And while home inventory is increasing, total market inventory remains lean at a 4.4 months’ supply, indicating a long-run need for more home construction.”
The July HMI survey also revealed that 31% of builders cut home prices to bolster sales in July, above the June rate of 29%. However, the average price reduction in July held steady at 6% for the 13th straight month. Meanwhile, the use of sales incentives held steady at 61% in July, the same reading as June.
...
The HMI index charting current sales conditions in July fell one point to 47 and the gauge charting traffic of prospective buyers also declined by a single-point to 27. The component measuring sales expectations in the next six months increased one point to 48.
Looking at the three-month moving averages for regional HMI scores, the Northeast fell six points to 56, the Midwest dropped four points to 43, the South decreased two points to 44 and the West posted a four-point decline to 37.
emphasis added
 Click on graph for larger image.
This graph shows the NAHB index since Jan 1985.
This was slightly below the consensus forecast.
Retail Sales Unchanged in June
by Calculated Risk on 7/16/2024 08:30:00 AM
On a monthly basis, retail sales were "virtually unchanged" from May to June (seasonally adjusted), and sales were up 2.3 percent from June 2023.
From the Census Bureau report:
Advance estimates of U.S. retail and food services sales for June 2024, adjusted for seasonal variation and holiday and trading-day differences, but not for price changes, were $704.3 billion, virtually unchanged from the previous month, but up 2.3 percent above June 2023. ... The April 2024 to May 2024 percent change was revised from up 0.1 percent to up 0.3 percent.
emphasis added
 Click on graph for larger image.
This graph shows retail sales since 1992. This is monthly retail sales and food service, seasonally adjusted (total and ex-gasoline).
Retail sales ex-gasoline were up 0.2% in June.
The second graph shows the year-over-year change in retail sales and food service (ex-gasoline) since 1993.
Retail and Food service sales, ex-gasoline, increased by 2.7% on a YoY basis.
 The change in sales in June was at expectations, and sales in April and May were revised up.
Monday, July 15, 2024
Tuesday: Retail Sales, Homebuilder Survey
by Calculated Risk on 7/15/2024 07:13:00 PM
 From Matthew Graham at Mortgage News Daily: Mortgage Rates' Impressive Winning Streak Faces Increasing Resistance
We occasionally reference 5 day winning streaks for mortgage rates as the sort of uncommon occurrence that greatly increases the odds of at least a temporary pullback. Longer streaks do happen, but odds of a pullback increase sharply after 8 days.Tuesday:
With all that in mind, today marked the 8th straight day of improvement in mortgage rates.[30 year fixed 6.81%]
emphasis added
• At 8:30 AM ET, Retail sales for June is scheduled to be released. The consensus is for no change in retail sales.
• At 10:00 AM, The July NAHB homebuilder survey. The consensus is for a reading of 44, up from 43. Any number below 50 indicates that more builders view sales conditions as poor than good.


