 RSS Feed
 by Calculated Risk on 7/31/2024 08:18:00 AM
Wednesday, July 31, 2024
ADP: Private Employment Increased 122,000 in July
Private sector employment increased by 122,000 jobs in July and annual pay was up 4.8 percent year-over-year, according to the July ADP® National Employment ReportTM produced by the ADP Research Institute® in collaboration with the Stanford Digital Economy Lab (“Stanford Lab”). ...This was below the consensus forecast of 168,000. The BLS report will be released Friday, and the consensus is for 175,000 non-farm payroll jobs added in July.
“With wage growth abating, the labor market is playing along with the Federal Reserve's effort to slow inflation,” said Nela Richardson, chief economist, ADP. “If inflation goes back up, it won't be because of labor.”
emphasis added
MBA: Mortgage Applications Decreased in Weekly Survey
by Calculated Risk on 7/31/2024 07:00:00 AM
From the MBA: Mortgage Applications Decrease in Latest MBA Weekly Survey
Mortgage applications decreased 3.9 percent from one week earlier, according to data from the Mortgage Bankers Association’s (MBA) Weekly Applications Survey for the week ending July 26, 2024.
The Market Composite Index, a measure of mortgage loan application volume, decreased 3.9 percent on a seasonally adjusted basis from one week earlier. On an unadjusted basis, the Index decreased 4 percent compared with the previous week. The Refinance Index decreased 7 percent from the previous week and was 32 percent higher than the same week one year ago. The seasonally adjusted Purchase Index decreased 2 percent from one week earlier. The unadjusted Purchase Index decreased 1 percent compared with the previous week and was 14 percent lower than the same week one year ago.
"Mortgage rates were little changed last week, with the 30-year fixed mortgage rate unchanged at 6.82 percent," said Mike Fratantoni, MBA's SVP and Chief Economist. "In recent weeks, there have been some small bursts of refinance activity, particularly for FHA and VA loans. Last week, VA refi application volume dropped sharply, which drove the aggregate result. Borrowers may be waiting for signs that mortgage rates will drift lower as the Federal Reserve begins to cut short-term rates. Purchase volume also dropped slightly because of ongoing affordability challenges.”
...
The average contract interest rate for 30-year fixed-rate mortgages with conforming loan balances ($766,550 or less) remained unchanged at 6.82 percent, with points increasing to 0.62 from 0.59 (including the origination fee) for 80 percent loan-to-value ratio (LTV) loans.
emphasis added
 Click on graph for larger image.
The first graph shows the MBA mortgage purchase index.
According to the MBA, purchase activity is down 14% year-over-year unadjusted.
Red is a four-week average (blue is weekly).
Purchase application activity is up about 6% from the lows in late October 2023, but still below the lowest levels during the housing bust.

The second graph shows the refinance index since 1990.
With higher mortgage rates, the refinance index declined sharply in 2022, and mostly flat lined since then with some increase recently.
Tuesday, July 30, 2024
Wednesday: FOMC Statement, Pending Home Sales, Chicago PMI
by Calculated Risk on 7/30/2024 07:22:00 PM
 Note: Mortgage rates are from MortgageNewsDaily.com and are for top tier scenarios.
Wednesday:
• At 7:00 AM ET, The Mortgage Bankers Association (MBA) will release the results for the mortgage purchase applications index.
• At 8:15 AM: The ADP Employment Report for June. This report is for private payrolls only (no government). The consensus is for 168,000 payroll jobs added in June, up from 150,000 in May.
• At 9:45 AM: Chicago Purchasing Managers Index for July.
• At 10:00 AM: Pending Home Sales Index for June. The consensus is for a 1.5% increase in the index.
• At 2:00 PM: FOMC Meeting Announcement. No change to the Fed Funds rate is expected.
• At 2:30 PM: Fed Chair Jerome Powell holds a press briefing following the FOMC announcement.
HVS: Q2 2024 Homeownership and Vacancy Rates
by Calculated Risk on 7/30/2024 01:23:00 PM
The Census Bureau released the Residential Vacancies and Homeownership report for Q2 2024 today.
The results of this survey were significantly distorted by the pandemic in 2020.
This report is frequently mentioned by analysts and the media to track household formation, the homeownership rate, and the homeowner and rental vacancy rates. However, there are serious questions about the accuracy of this survey.
This survey might show the trend, but I wouldn't rely on the absolute numbers. Analysts probably shouldn't use the HVS to estimate the excess vacant supply or household formation, or rely on the homeownership rate, except as a guide to the trend.
National vacancy rates in the second quarter 2024 were 6.6 percent for rental housing and 0.9 percent for homeowner housing. The rental vacancy rate was higher than the rate in the second quarter 2023 (6.3 percent) and virtually the same as the rate in the first quarter 2024 (6.6 percent).
The homeowner vacancy rate of 0.9 percent was higher than the rate in the second quarter 2023 (0.7 percent) and higher than the rate in the first quarter 2024 (0.8 percent).
The homeownership rate of 65.6 percent was not statistically different from the rate in the second quarter 2023 (65.9 percent) and virtually the same as the rate in the first quarter 2024 (65.6 percent).
emphasis added
 Click on graph for larger image.
The Red dots are the decennial Census homeownership rates for April 1st, 1990, 2000, 2010, and 2020.
The HVS homeownership rate was unchanged at 65.6% in Q2, from 65.6% in Q1.
The HVS homeownership rate was unchanged at 65.6% in Q2, from 65.6% in Q1.
The results in Q2 and Q3 2020 were distorted by the pandemic and should be ignored.
 The HVS homeowner vacancy increased to 0.9% in Q2 from 0.8% in Q1.
 Once again - this probably shows the general trend, but I wouldn't rely on the absolute numbers.
The homeowner vacancy rate declined sharply during the pandemic and includes homes that are vacant and for sale (so this mirrors the low levels of existing home inventory).
 The rental vacancy rate was unchanged at 6.6% in Q2 from 6.6% in Q1. This is up from the low of 5.6% in 2021 and 2022.
The quarterly HVS is the timeliest survey on households, but there are many questions about the accuracy of this survey.
Comments on May Case-Shiller House Prices, FHFA: House Prices Unchanged in May
by Calculated Risk on 7/30/2024 10:18:00 AM
Today, in the Calculated Risk Real Estate Newsletter: Case-Shiller: National House Price Index Up 5.9% year-over-year in May; FHFA House Price Index Unchanged in May, up 5.7% YoY
Excerpt:
S&P/Case-Shiller released the monthly Home Price Indices for May ("May" is a 3-month average of March, April and May closing prices). May closing prices include some contracts signed in January, so there is a significant lag to this data. Here is a graph of the month-over-month (MoM) change in the Case-Shiller National Index Seasonally Adjusted (SA).
The MoM increase in the seasonally adjusted (SA) Case-Shiller National Index was at 0.25%. This was the sixteenth consecutive MoM increase, but this tied December as the smallest MoM increase in the last 15 months.
On a seasonally adjusted basis, prices increased month-to-month in 17 of the 20 Case-Shiller cities. Seasonally adjusted, San Francisco has fallen 7.5% from the recent peak, Seattle is down 5.4% from the peak, Portland down 4.3%, and Phoenix is down 4.3%.

There is much more in the article.
BLS: Job Openings "Unchanged" at 8.2 million in June
by Calculated Risk on 7/30/2024 10:00:00 AM
From the BLS: Job Openings and Labor Turnover Summary
The number of job openings was unchanged at 8.2 million on the last business day of June, the U.S. Bureau of Labor Statistics reported today. Over the month, both the number of hires and total separations were little changed at 5.3 million and 5.1 million, respectively. Within separations, quits (3.3 million) and layoffs and discharges (1.5 million) changed little.The following graph shows job openings (black line), hires (dark blue), Layoff, Discharges and other (red column), and Quits (light blue column) from the JOLTS.
emphasis added
This series started in December 2000.
Note: The difference between JOLTS hires and separations is similar to the CES (payroll survey) net jobs headline numbers. This report is for June; the employment report this Friday will be for July.
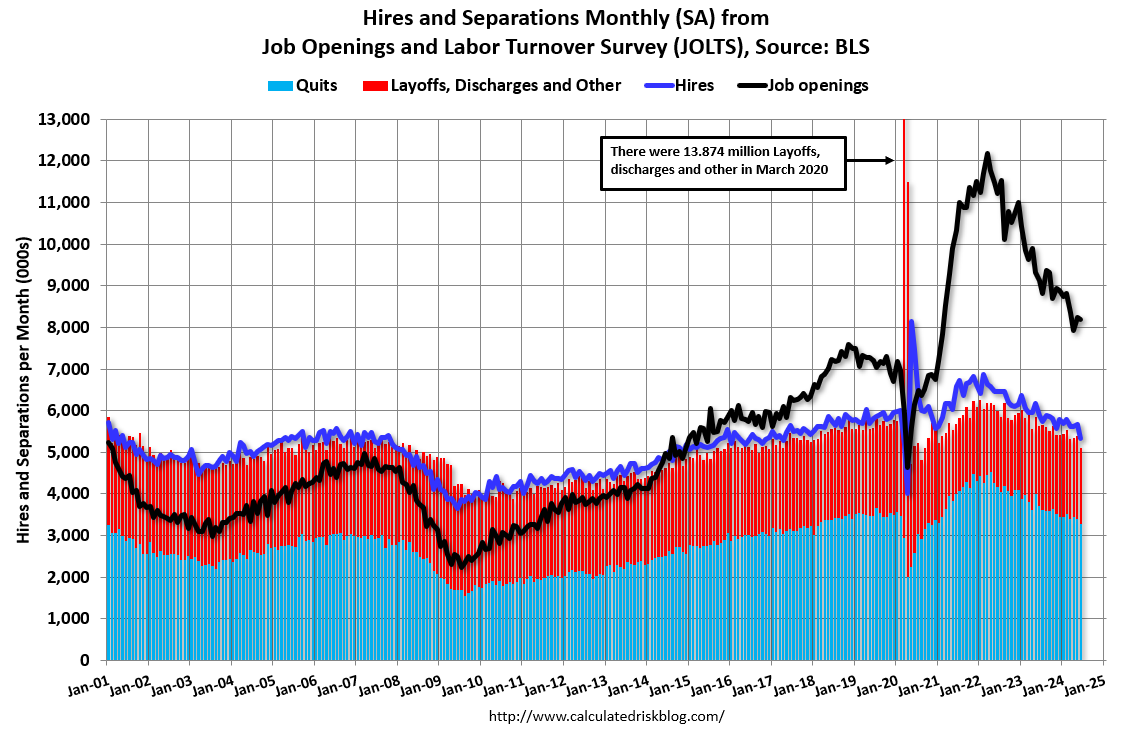 Click on graph for larger image.
Note that hires (dark blue) and total separations (red and light blue columns stacked) are usually pretty close each month. This is a measure of labor market turnover. When the blue line is above the two stacked columns, the economy is adding net jobs - when it is below the columns, the economy is losing jobs.
The spike in layoffs and discharges in March 2020 is labeled, but off the chart to better show the usual data.
Jobs openings decreased in June to 8.18 million from 8.23 million in May.
The number of job openings (black) were down 10% year-over-year.
Quits were down 12% year-over-year. These are voluntary separations. (See light blue columns at bottom of graph for trend for "quits").
Case-Shiller: National House Price Index Up 5.9% year-over-year in May
by Calculated Risk on 7/30/2024 09:00:00 AM
S&P/Case-Shiller released the monthly Home Price Indices for May ("May" is a 3-month average of March, April and May closing prices).
This release includes prices for 20 individual cities, two composite indices (for 10 cities and 20 cities) and the monthly National index.
From S&P S&P CoreLogic Case-Shiller Index Again Breaks Previous Month's All-Time High for May 2024
The S&P CoreLogic Case-Shiller U.S. National Home Price NSA Index, covering all nine U.S. census divisions, reported a 5.9% annual gain for May, down from a 6.4% annual gain in the previous month. The 10-City Composite saw an annual increase of 7.7%, down from an 8.1% annual increase in the previous month. The 20-City Composite posted a year-over-year increase of 6.8%, dropping from a 7.3% increase in the previous month. New York reported the highest annual gain among the 20 cities with a 9.4% increase in May, followed by San Diego and Las Vegas with increases of 9.1% and 8.6%, respectively. Portland once again held the lowest rank for the smallest year-over-year growth, notching a 1.0% annual increase in May.
...
The U.S. National Index, the 20-City Composite, and the 10-City Composite upward trends continued to decelerate from last month, with pre-seasonality adjustment increases of 0.9%, 1.0%, and 1.0%, respectively.
After seasonal adjustment, the U.S. National Index posted the same month-over-month change of 0.3% as last month, while the 20-City and 10-City Composite reported a monthly change of 0.3% and 0.4%, respectively.
“While annual gains have decelerated recently, this may have more to do with 2023 than 2024, as recent performance remains encouraging,” says Brian D. Luke, Head of Commodities, Real & Digital Assets. “Our home price index has appreciated 4.1% year-to-date, the fastest start in two years. Covering the six-month period dating to when mortgage rates peaked, our national index has risen the past four months, erasing the stall experienced late last year. Collectively, all 20 markets covered continue to trade in a homogeneous pattern. Coming into the 2024 presidential election, traditional red states are in a dead heat with blue states, both averaging 5.9% gains annually.
“The Big Apple returned to the top of the leader boards, toppling San Diego from its six-month perch. New York’s 9.4% annual return outpaced San Diego and Las Vegas, by 0.3% and 0.7%, respectively. All 20 markets observed annual gains for the last six months. The last time we saw that long a streak was when all markets rose for three years consecutively during the COVID housing boom. This rally pales in comparison in both duration and annual gains, with above trend growth of 6.2%. The waiting game for the possibility of favorable changes in lending rates continues to be costly for potential buyers as home prices march forward.”
emphasis added
 Click on graph for larger image.
 The first graph shows the nominal seasonally adjusted Composite 10, Composite 20 and National indices (the Composite 20 was started in January 2000).
The Composite 10 index was up 0.4% in May (SA). The Composite 20 index was up 0.3% (SA) in May.
The National index was up 0.3% (SA) in May.
 The second graph shows the year-over-year change in all three indices.
The Composite 10 SA was up 7.7% year-over-year. The Composite 20 SA was up 6.8% year-over-year.
The National index SA was up 5.9% year-over-year.
Annual price changes were close to expectations. I'll have more later.
Monday, July 29, 2024
Tuesday: Case-Shiller House Prices, Job Openings
by Calculated Risk on 7/29/2024 08:15:00 PM
 From Matthew Graham at Mortgage News Daily: Mortgage Rates Start Week at 6 Month Lows
Although the range has been very narrow for the past few weeks, average mortgage rates nonetheless fell to the lowest levels in more than 6 months. Top tier conventional 30yr fixed scenarios are well into the high 6's now, with our proprietary daily average at 6.81, matching the levels seen on July 15th and 18th.Tuesday:
...
The rest of the week is most likely to be determined by economic reports as well as the reaction to Wednesday's Fed announcement. The Fed is not expected to cut rates at this meeting, but some investors will be looking for clues about a September rate cut, currently seen as a near certainty. [30 year fixed 6.81%]
emphasis added
• At 9:00 AM ET, S&P/Case-Shiller House Price Index for May. The consensus is for a 6.0% year-over-year increase in the Comp 20 index for May.
• Also at 9:00 AM, FHFA House Price Index for May. This was originally a GSE only repeat sales, however there is also an expanded index.
• At 10:00 AM ET: Job Openings and Labor Turnover Survey for June from the BLS.
Fannie and Freddie: Single Family Serious Delinquency Rate Mostly Unchanged in June, Multi-family Increased
by Calculated Risk on 7/29/2024 05:05:00 PM
Today, in the Calculated Risk Real Estate Newsletter: Fannie and Freddie: Single Family Serious Delinquency Rate Mostly Unchanged in June, Multi-family Increased
Brief excerpt:
Single-family serious delinquencies were mostly unchanged in June, and multi-family serious delinquencies increased again.
...
Freddie Mac reports that the multi-family delinquencies rate increased to 0.38% in June, up from 0.36% in April, but down from the recent peak of 0.44% in January.
This graph shows the Freddie multi-family serious delinquency rate since 2012. Rates were still high in 2012 following the housing bust and financial crisis.
The multi-family rate increased following the pandemic and has increased recently as rent growth has slowed, vacancy rates have increased, and borrowing rates have increased sharply. The rate surged higher in January and then declined in February and March but has been increasing again. This will be something to watch as more apartments come on the market.

There is much more in the article.
Final Look at Local Housing Markets in June and a Look Ahead to July Sales
by Calculated Risk on 7/29/2024 09:58:00 AM
Today, in the Calculated Risk Real Estate Newsletter: Final Look at Local Housing Markets in June and a Look Ahead to July Sales
A brief excerpt:
In June, sales in these markets were down 13.1% YoY. Last month, in May, these same markets were down 0.1% year-over-year Not Seasonally Adjusted (NSA).There is much more in the article.
...
This was a year-over-year decrease NSA for these markets. However, there were two fewer working days in June 2024 compared to June 2023 (19 vs 21), so seasonally adjusted sales were much higher than the NSA data suggests. Note that the NAR reported sales NSA were down 13.4% YoY in June, almost the same as this local data!
July sales will be mostly for contracts signed in May and June, and mortgage rates decreased slightly to an average of 6.92% in June, down from 7.06% in May. My early expectation is we will see existing home sales at or above the same level in July as compared to June, on a seasonally adjusted annual rate basis (SAAR).
Note for next month (July sales): There were two more working days in July 2024 compared to July 2023 (22 vs 20), so seasonally adjusted sales will be much lower than the NSA data suggests.


