 RSS Feed
 by Calculated Risk on 8/01/2024 08:30:00 AM
Thursday, August 01, 2024
Weekly Initial Unemployment Claims Increase to 249,000
The DOL reported:
In the week ending July 27, the advance figure for seasonally adjusted initial claims was 249,000, an increase of 14,000 from the previous week's unrevised level of 235,000. The 4-week moving average was 238,000, an increase of 2,500 from the previous week's unrevised average of 235,500.The following graph shows the 4-week moving average of weekly claims since 1971.
emphasis added
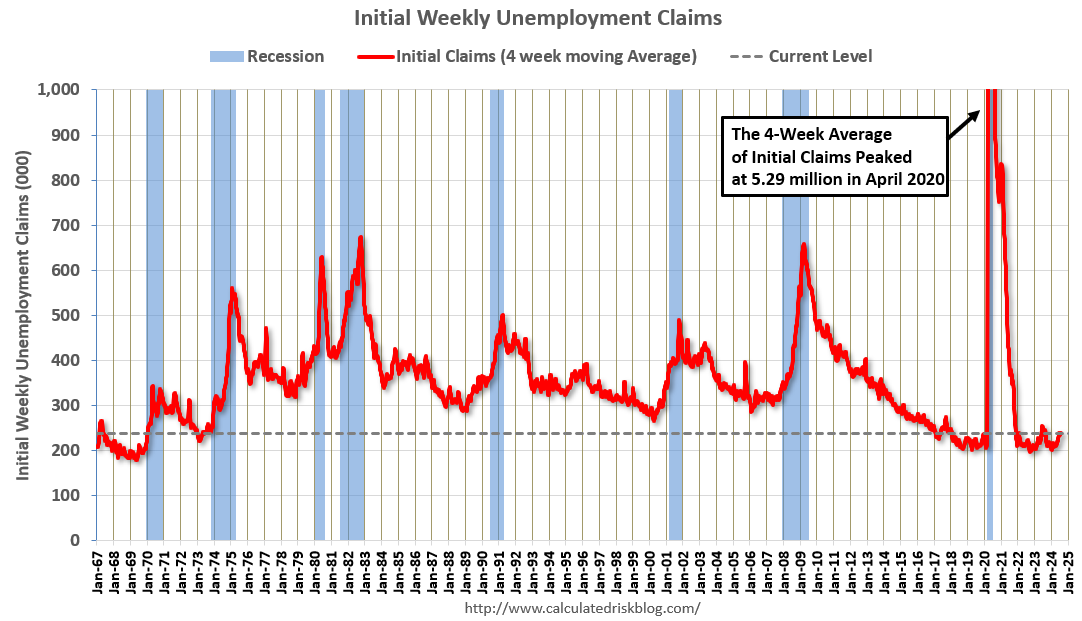 Click on graph for larger image.
The dashed line on the graph is the current 4-week average. The four-week average of weekly unemployment claims increased to 238,000.
The previous week was unrevised.
Weekly claims were higher than the consensus forecast.
Wednesday, July 31, 2024
Thursday: Unemployment Claims, ISM Mfg, Construction Spending, Vehicle Sales
by Calculated Risk on 7/31/2024 07:16:00 PM
 Note: Mortgage rates are from MortgageNewsDaily.com and are for top tier scenarios.
Thursday:
• At 8:30 AM ET, The initial weekly unemployment claims report will be released. The consensus is for 230 thousand initial claims, down from 235 thousand last week.
• At 10:00 AM, ISM Manufacturing Index for July. The consensus is for the ISM to be at 49.0, up from 48.5 in June.
• At 10:00 AM, Construction Spending for June. The consensus is for a 0.2% increase in construction spending.
• Late, Light vehicle sales for July from the BEA. The consensus is for light vehicle sales to be 16.2 million SAAR in July, up from 15.3 million in June (Seasonally Adjusted Annual Rate).
FOMC Statement: No Change to Fed Funds Rate
by Calculated Risk on 7/31/2024 02:00:00 PM
Fed Chair Powell press conference video here or on YouTube here, starting at 2:30 PM ET.
FOMC Statement:
Recent indicators suggest that economic activity has continued to expand at a solid pace. Job gains have moderated, and the unemployment rate has moved up but remains low. Inflation has eased over the past year but remains somewhat elevated. In recent months, there has been some further progress toward the Committee's 2 percent inflation objective.
The Committee seeks to achieve maximum employment and inflation at the rate of 2 percent over the longer run. The Committee judges that the risks to achieving its employment and inflation goals continue to move into better balance. The economic outlook is uncertain, and the Committee is attentive to the risks to both sides of its dual mandate.
In support of its goals, the Committee decided to maintain the target range for the federal funds rate at 5-1/4 to 5-1/2 percent;. In considering any adjustments to the target range for the federal funds rate, the Committee will carefully assess incoming data, the evolving outlook, and the balance of risks. The Committee does not expect it will be appropriate to reduce the target range until it has gained greater confidence that inflation is moving sustainably toward 2 percent. In addition, the Committee will continue reducing its holdings of Treasury securities and agency debt and agency mortgage‑backed securities. The Committee is strongly committed to returning inflation to its 2 percent objective.
In assessing the appropriate stance of monetary policy, the Committee will continue to monitor the implications of incoming information for the economic outlook. The Committee would be prepared to adjust the stance of monetary policy as appropriate if risks emerge that could impede the attainment of the Committee's goals. The Committee's assessments will take into account a wide range of information, including readings on labor market conditions, inflation pressures and inflation expectations, and financial and international developments.
Voting for the monetary policy action were Jerome H. Powell, Chair; John C. Williams, Vice Chair; Thomas I. Barkin; Michael S. Barr; Raphael W. Bostic; Michelle W. Bowman; Lisa D. Cook; Mary C. Daly; Austan D. Goolsbee; Philip N. Jefferson; Adriana D. Kugler; and Christopher J. Waller. Austan D. Goolsbee voted as an alternate member at this meeting.
emphasis added
Freddie Mac House Price Index Increased Slightly in June; Up 5.1% Year-over-year
by Calculated Risk on 7/31/2024 10:51:00 AM
Today, in the Calculated Risk Real Estate Newsletter: Freddie Mac House Price Index Increased Slightly in June; Up 5.1% Year-over-year
A brief excerpt:
Freddie Mac reported that its “National” Home Price Index (FMHPI) increased 0.06% month-over-month on a seasonally adjusted (SA) basis in June. On a year-over-year basis, the National FMHPI was up 5.1% in June, down from up 5.7% YoY in May. The YoY increase peaked at 19.1% in July 2021, and for this cycle, bottomed at up 0.9% YoY in May 2023. ...
As of June, 19 states and D.C. were below their previous peaks, Seasonally Adjusted. The largest seasonally adjusted declines from the recent peak were in Idaho (-4.2%), Montana (-2.5%), Arkansas (-2.0), Texas (-1.7%), Hawaii (-1.7%) and Utah (-1.6%).
For cities (Core-based Statistical Areas, CBSA), here are the 30 cities with the largest declines from the peak, seasonally adjusted. Austin continues to be the worst performing city.

There is much more in the article.
NAR: Pending Home Sales Increase 4.8% in June; Down 2.6% Year-over-year
by Calculated Risk on 7/31/2024 10:00:00 AM
From the NAR: Pending Home Sales Rose 4.8% in June
Pending home sales in June ascended 4.8%, according to the National Association of REALTORS®. All four U.S. regions posted monthly gains in transactions. Year-over-year, the Northeast, Midwest and South registered declines, while the West increased.This was above expectations. Note: Contract signings usually lead sales by about 45 to 60 days, so this would usually be for closed sales in July and August.
The Pending Home Sales Index (PHSI)* – a forward-looking indicator of home sales based on contract signings – grew to 74.3 in June. Year over year, pending transactions were down 2.6%. An index of 100 is equal to the level of contract activity in 2001.
"The rise in housing inventory is beginning to lead to more contract signings," said NAR Chief Economist Lawrence Yun. "Multiple offers are less intense, and buyers are in a more favorable position."
...
The Northeast PHSI ascended 3.0% from last month to 65.5, a decline of 0.3% from June 2023. The Midwest index rose 4.7% to 73.7 in June, down 4.2% from one year ago.
The South PHSI increased 6.3% to 89.3 in June, dropping 3.9% from the prior year. The West index climbed 3.4% in June to 58.4, up 1.0% from June 2023.
emphasis added
ADP: Private Employment Increased 122,000 in July
by Calculated Risk on 7/31/2024 08:18:00 AM
Private sector employment increased by 122,000 jobs in July and annual pay was up 4.8 percent year-over-year, according to the July ADP® National Employment ReportTM produced by the ADP Research Institute® in collaboration with the Stanford Digital Economy Lab (“Stanford Lab”). ...This was below the consensus forecast of 168,000. The BLS report will be released Friday, and the consensus is for 175,000 non-farm payroll jobs added in July.
“With wage growth abating, the labor market is playing along with the Federal Reserve's effort to slow inflation,” said Nela Richardson, chief economist, ADP. “If inflation goes back up, it won't be because of labor.”
emphasis added
MBA: Mortgage Applications Decreased in Weekly Survey
by Calculated Risk on 7/31/2024 07:00:00 AM
From the MBA: Mortgage Applications Decrease in Latest MBA Weekly Survey
Mortgage applications decreased 3.9 percent from one week earlier, according to data from the Mortgage Bankers Association’s (MBA) Weekly Applications Survey for the week ending July 26, 2024.
The Market Composite Index, a measure of mortgage loan application volume, decreased 3.9 percent on a seasonally adjusted basis from one week earlier. On an unadjusted basis, the Index decreased 4 percent compared with the previous week. The Refinance Index decreased 7 percent from the previous week and was 32 percent higher than the same week one year ago. The seasonally adjusted Purchase Index decreased 2 percent from one week earlier. The unadjusted Purchase Index decreased 1 percent compared with the previous week and was 14 percent lower than the same week one year ago.
"Mortgage rates were little changed last week, with the 30-year fixed mortgage rate unchanged at 6.82 percent," said Mike Fratantoni, MBA's SVP and Chief Economist. "In recent weeks, there have been some small bursts of refinance activity, particularly for FHA and VA loans. Last week, VA refi application volume dropped sharply, which drove the aggregate result. Borrowers may be waiting for signs that mortgage rates will drift lower as the Federal Reserve begins to cut short-term rates. Purchase volume also dropped slightly because of ongoing affordability challenges.”
...
The average contract interest rate for 30-year fixed-rate mortgages with conforming loan balances ($766,550 or less) remained unchanged at 6.82 percent, with points increasing to 0.62 from 0.59 (including the origination fee) for 80 percent loan-to-value ratio (LTV) loans.
emphasis added
 Click on graph for larger image.
The first graph shows the MBA mortgage purchase index.
According to the MBA, purchase activity is down 14% year-over-year unadjusted.
Red is a four-week average (blue is weekly).
Purchase application activity is up about 6% from the lows in late October 2023, but still below the lowest levels during the housing bust.

The second graph shows the refinance index since 1990.
With higher mortgage rates, the refinance index declined sharply in 2022, and mostly flat lined since then with some increase recently.
Tuesday, July 30, 2024
Wednesday: FOMC Statement, Pending Home Sales, Chicago PMI
by Calculated Risk on 7/30/2024 07:22:00 PM
 Note: Mortgage rates are from MortgageNewsDaily.com and are for top tier scenarios.
Wednesday:
• At 7:00 AM ET, The Mortgage Bankers Association (MBA) will release the results for the mortgage purchase applications index.
• At 8:15 AM: The ADP Employment Report for June. This report is for private payrolls only (no government). The consensus is for 168,000 payroll jobs added in June, up from 150,000 in May.
• At 9:45 AM: Chicago Purchasing Managers Index for July.
• At 10:00 AM: Pending Home Sales Index for June. The consensus is for a 1.5% increase in the index.
• At 2:00 PM: FOMC Meeting Announcement. No change to the Fed Funds rate is expected.
• At 2:30 PM: Fed Chair Jerome Powell holds a press briefing following the FOMC announcement.
HVS: Q2 2024 Homeownership and Vacancy Rates
by Calculated Risk on 7/30/2024 01:23:00 PM
The Census Bureau released the Residential Vacancies and Homeownership report for Q2 2024 today.
The results of this survey were significantly distorted by the pandemic in 2020.
This report is frequently mentioned by analysts and the media to track household formation, the homeownership rate, and the homeowner and rental vacancy rates. However, there are serious questions about the accuracy of this survey.
This survey might show the trend, but I wouldn't rely on the absolute numbers. Analysts probably shouldn't use the HVS to estimate the excess vacant supply or household formation, or rely on the homeownership rate, except as a guide to the trend.
National vacancy rates in the second quarter 2024 were 6.6 percent for rental housing and 0.9 percent for homeowner housing. The rental vacancy rate was higher than the rate in the second quarter 2023 (6.3 percent) and virtually the same as the rate in the first quarter 2024 (6.6 percent).
The homeowner vacancy rate of 0.9 percent was higher than the rate in the second quarter 2023 (0.7 percent) and higher than the rate in the first quarter 2024 (0.8 percent).
The homeownership rate of 65.6 percent was not statistically different from the rate in the second quarter 2023 (65.9 percent) and virtually the same as the rate in the first quarter 2024 (65.6 percent).
emphasis added
 Click on graph for larger image.
The Red dots are the decennial Census homeownership rates for April 1st, 1990, 2000, 2010, and 2020.
The HVS homeownership rate was unchanged at 65.6% in Q2, from 65.6% in Q1.
The HVS homeownership rate was unchanged at 65.6% in Q2, from 65.6% in Q1.
The results in Q2 and Q3 2020 were distorted by the pandemic and should be ignored.
 The HVS homeowner vacancy increased to 0.9% in Q2 from 0.8% in Q1.
 Once again - this probably shows the general trend, but I wouldn't rely on the absolute numbers.
The homeowner vacancy rate declined sharply during the pandemic and includes homes that are vacant and for sale (so this mirrors the low levels of existing home inventory).
 The rental vacancy rate was unchanged at 6.6% in Q2 from 6.6% in Q1. This is up from the low of 5.6% in 2021 and 2022.
The quarterly HVS is the timeliest survey on households, but there are many questions about the accuracy of this survey.
Comments on May Case-Shiller House Prices, FHFA: House Prices Unchanged in May
by Calculated Risk on 7/30/2024 10:18:00 AM
Today, in the Calculated Risk Real Estate Newsletter: Case-Shiller: National House Price Index Up 5.9% year-over-year in May; FHFA House Price Index Unchanged in May, up 5.7% YoY
Excerpt:
S&P/Case-Shiller released the monthly Home Price Indices for May ("May" is a 3-month average of March, April and May closing prices). May closing prices include some contracts signed in January, so there is a significant lag to this data. Here is a graph of the month-over-month (MoM) change in the Case-Shiller National Index Seasonally Adjusted (SA).
The MoM increase in the seasonally adjusted (SA) Case-Shiller National Index was at 0.25%. This was the sixteenth consecutive MoM increase, but this tied December as the smallest MoM increase in the last 15 months.
On a seasonally adjusted basis, prices increased month-to-month in 17 of the 20 Case-Shiller cities. Seasonally adjusted, San Francisco has fallen 7.5% from the recent peak, Seattle is down 5.4% from the peak, Portland down 4.3%, and Phoenix is down 4.3%.

There is much more in the article.


