 RSS Feed
 by Calculated Risk on 8/02/2024 02:33:00 PM
Friday, August 02, 2024
Realtor.com Reports Active Inventory Up 37.1% YoY
What this means: On a weekly basis, Realtor.com reports the year-over-year change in active inventory and new listings. On a monthly basis, they report total inventory. For June, Realtor.com reported inventory was up 36.6% YoY, but still down 30.6% compared to April 2017 to 2019 levels.
Now - on a weekly basis - inventory is up 37.1% YoY.
Realtor.com has monthly and weekly data on the existing home market. Here is their weekly report: Weekly Housing Trends View—Data for Week Ending July 27, 2024 Here is a graph of the year-over-year change in inventory according to realtor.com.
Inventory was up year-over-year for the 38th consecutive week.
Realtor.com has monthly and weekly data on the existing home market. Here is their weekly report: Weekly Housing Trends View—Data for Week Ending July 27, 2024
• Active inventory increased, with for-sale homes 37.1% above year-ago levels.
For the 38th week in a row, the number of for-sale homes grew compared with one year ago. This past week, the inventory of homes for sale grew by 37.1% compared with last year, slightly higher than the rate observed in the previous week.
• New listings–a measure of sellers putting homes up for sale–were up this week by 6.4% from one year ago.
This week’s decrease in new listings bucked the recent trend of new listing growth, which had posted a positive year-over-year figure in 15 of the last 17 weeks. On a monthly basis, June saw new listings grow at a 6.3% annual rate, so this week’s data appears to signal a slowdown in housing inventory being added to the market.
 Here is a graph of the year-over-year change in inventory according to realtor.com.
 Inventory was up year-over-year for the 38th consecutive week.
However, inventory is still historically low.
New listings remain below typical pre-pandemic levels.
Vehicles Sales Increase to 15.8 million SAAR in July
by Calculated Risk on 8/02/2024 12:03:00 PM
The BEA released their estimate of light vehicle sales for July this morning.
 Click on graph for larger image.
This graph shows light vehicle sales since 2006 from the BEA (blue) and BEA's estimate for July (red).
Sales in July (15.82 million SAAR) were up 4.2% from June, and down 0.8% from July 2023.
Sales in July were below the consensus forecast of 16.2 million.
The second graph shows light vehicle sales since the BEA started keeping data in 1967.

Sales in July were below the consensus forecast of 16.2 million.

Asking Rents Mostly Unchanged Year-over-year
by Calculated Risk on 8/02/2024 11:05:00 AM
Today, in the Real Estate Newsletter: Asking Rents Mostly Unchanged Year-over-year
Brief excerpt:
Tracking rents is important for understanding the dynamics of the housing market. For example, the sharp increase in rents helped me deduce that there was a surge in household formation in 2021 (See from September 2021: Household Formation Drives Housing Demand). Now that household formation has slowed, and multi-family completions have increased, rents are under pressure....
Welcome to the August 2024 Apartment List National Rent Report. Rent prices ticked up for the sixth straight month, but rent growth over the course of 2024 as a whole remains modest, signaling ongoing sluggishness in the market. And while month-over-month rent growth remains positive, it is decelerating. Prices increased just 0.2% in July and today the nationwide median rent stands at $1,414. It is very possible that rent growth will turn flat or negative in August, and stay there for the remainder of the year.

Realtor.com: Eleventh Consecutive Month with Year-over-year Decline in Rents
In June 2024, the U.S. median rent continued to decline year over year for the 11th month in a row, down $7 (-0.4%) for 0-2 bedroom properties across the top 50 metros, slower than the rate seen in May 2024. The median asking rent was $1,743, up by $13 from last month following a typical seasonal trend.
Comments on July Employment Report
by Calculated Risk on 8/02/2024 09:08:00 AM
The headline jobs number in the July employment report was below expectations, and May and June payrolls were revised down by 29,000 combined. The participation rate increased, the employment population ratio decreased, and the unemployment rate increased to 4.3%.
Construction employment increased 25 thousand and is now 645 thousand above the pre-pandemic level.
Manufacturing employment increased 1 thousand and is now 173 thousand above the pre-pandemic level.
Prime (25 to 54 Years Old) Participation
 Since the overall participation rate is impacted by both cyclical (recession) and demographic (aging population, younger people staying in school) reasons, here is the employment-population ratio for the key working age group: 25 to 54 years old.
The 25 to 54 years old participation rate increased in July to 84.0% from 83.7% in June to the highest level since 2001.
The 25 to 54 employment population ratio increased to 80.9% from 80.8% the previous month.
Both are above pre-pandemic levels and near the highest level this millennium.
Average Hourly Wages
 The graph shows the nominal year-over-year change in "Average Hourly Earnings" for all private employees from the Current Employment Statistics (CES).
Average Hourly Wages
 The graph shows the nominal year-over-year change in "Average Hourly Earnings" for all private employees from the Current Employment Statistics (CES).
 There was a huge increase at the beginning of the pandemic as lower paid employees were let go, and then the pandemic related spike reversed a year later.
Wage growth has trended down after peaking at 5.9% YoY in March 2022 and was at 3.6% YoY in July.
Wage growth has trended down after peaking at 5.9% YoY in March 2022 and was at 3.6% YoY in July.
Part Time for Economic Reasons
 From the BLS report:
"The number of people employed part time for economic reasons rose by 346,000 to 4.6 million in July. These individuals, who would have preferred full-time employment, were working part time because their hours had been reduced or they were unable to find full-time jobs."The number of persons working part time for economic reasons increased in July to 4.57 million from 4.22 million in June. This is above the pre-pandemic levels.
These workers are included in the alternate measure of labor underutilization (U-6) that increased to 7.8 from 7.4% in the previous month. This is down from the record high in April 2020 of 23.0% and up from the lowest level on record (seasonally adjusted) in December 2022 (6.5%). (This series started in 1994). This measure is above the 7.0% level in February 2020 (pre-pandemic).
Unemployed over 26 Weeks
 This graph shows the number of workers unemployed for 27 weeks or more.
 According to the BLS, there are 1.535 million workers who have been unemployed for more than 26 weeks and still want a job, up from 1.516 million the previous month.
This is down from post-pandemic high of 4.174 million, and up from the recent low of 1.050 million.
This is above pre-pandemic levels.
Job Streak
Summary:
The headline jobs number in the July employment report was below expectations, and May and June payrolls were revised down by 29,000 combined. The participation rate increased, the employment population ratio decreased, and the unemployment rate increased to 4.3%.
This is above pre-pandemic levels.
Job Streak
Through July 2024, the employment report indicated positive job growth for 43 consecutive months, putting the current streak in 5th place of the longest job streaks in US history (since 1939).
| Headline Jobs, Top 10 Streaks | ||
|---|---|---|
| Year Ended | Streak, Months | |
| 1 | 2019 | 100 |
| 2 | 1990 | 48 |
| 3 | 2007 | 46 |
| 4 | 1979 | 45 |
| 5 | 20241 | 43 |
| 6 tie | 1943 | 33 |
| 6 tie | 1986 | 33 |
| 6 tie | 2000 | 33 |
| 9 | 1967 | 29 |
| 10 | 1995 | 25 |
| 1Currrent Streak | ||
Summary:
The headline jobs number in the July employment report was below expectations, and May and June payrolls were revised down by 29,000 combined. The participation rate increased, the employment population ratio decreased, and the unemployment rate increased to 4.3%.
A weaker than expected report, and the three-month average employment growth has slowed to 170 per month. The unemployment rate has increased from a low of 3.4% in early 2023 to 4.3% in July.
July Employment Report: 114 thousand Jobs, 4.3% Unemployment Rate
by Calculated Risk on 8/02/2024 08:30:00 AM
From the BLS: Employment Situation
The unemployment rate rose to 4.3 percent in July, and nonfarm payroll employment edged up by 114,000, the U.S. Bureau of Labor Statistics reported today. Employment continued to trend up in health care, in construction, and in transportation and warehousing, while information lost jobs.
...
The change in total nonfarm payroll employment for May was revised down by 2,000, from +218,000 to +216,000, and the change for June was revised down by 27,000, from +206,000 to +179,000. With these revisions, employment in May and June combined is 29,000 lower than previously reported.
emphasis added
 Click on graph for larger image.
The first graph shows the jobs added per month since January 2021.
Total payrolls increased by 114 thousand in July. Private payrolls increased by 97 thousand, and public payrolls increased 17 thousand.
Payrolls for May and June were revised down 29 thousand, combined.
Payrolls for May and June were revised down 29 thousand, combined.
 The second graph shows the year-over-year change in total non-farm employment since 1968.
In July, the year-over-year change was 2.51 million jobs. Employment was up solidly year-over-year.
The third graph shows the employment population ratio and the participation rate.
 The Labor Force Participation Rate increased to 62.7% in July, from 62.6% in June. This is the percentage of the working age population in the labor force.
 The Employment-Population ratio decreased to 60.0% from 60.1% in June (blue line).
I'll post the 25 to 54 age group employment-population ratio graph later.
 The fourth graph shows the unemployment rate.
 The unemployment rate increased to 4.3% in July from 4.1% in June.
This was well below consensus expectations, and May and June payrolls were revised down by 29,000 combined.
Thursday, August 01, 2024
Friday: Employment Report
by Calculated Risk on 8/01/2024 07:40:00 PM
 Note: Mortgage rates are from MortgageNewsDaily.com and are for top tier scenarios.
Friday:
• At 8:30 AM ET, Employment Report for July. The consensus is for 175,000 jobs added, and for the unemployment rate to be unchanged at 4.1%
July Employment Preview
by Calculated Risk on 8/01/2024 03:01:00 PM
On Friday at 8:30 AM ET, the BLS will release the employment report for July. The consensus is for 175,000 jobs added, and for the unemployment rate to be unchanged at 4.1%.
There were 206,000 jobs added in June, and the unemployment rate was at 4.1%.
From Goldman Sachs:
We estimate nonfarm payrolls rose by 165k in July, below consensus of +175k ... While an influx of labor supply at the start of summer typically leads to an acceleration in seasonally-adjusted job growth when the labor market is tight, alternative measures of job growth indicate a pace of job creation below the recent payrolls trend, and we assume a 15k drag from Hurricane Beryl. ... We estimate that the unemployment rate was unchanged at 4.1%—in line with consensus.From BofA:
emphasis added
Like the broader economy, the labor market is cooling but not cool. Nonfarm payrolls likely rose by a solid 225k in July after coming in at 206k in June. We look for the unemployment rate and labor force participation rate to remain unchanged at 4.1% and 62.6%, respectively.• ADP Report: The ADP employment report showed 122,000 private sector jobs were added in July. This was below consensus forecasts and suggests job gains below consensus expectations, however, in general, ADP hasn't been very useful in forecasting the BLS report.
• ISM Surveys: Note that the ISM indexes are diffusion indexes based on the number of firms hiring (not the number of hires). The ISM® manufacturing employment index was at 43.4%, down from 49.3% the previous month. This would suggest about 50,000 jobs lost in manufacturing. The ADP report indicated 4,000 manufacturing jobs lost in July.
The ISM® services employment index has not been released yet.
• Unemployment Claims: The weekly claims report showed more initial unemployment claims during the reference week at 245,000 in July compared to 239,000 in June. This suggests more layoffs in July compared to June.
• Conclusion: My guess is employment gains will be below consensus expectations.
Inflation Adjusted House Prices 1.9% Below 2022 Peak; Price-to-rent index is 7.6% below 2022 peak
by Calculated Risk on 8/01/2024 11:35:00 AM
Today, in the Calculated Risk Real Estate Newsletter: Inflation Adjusted House Prices 1.9% Below 2022 Peak
Excerpt:
It has been 18 years since the bubble peak. In the May Case-Shiller house price index released on Tuesday, the seasonally adjusted National Index (SA), was reported as being 73% above the bubble peak in 2006. However, in real terms, the National index (SA) is about 11% above the bubble peak (and historically there has been an upward slope to real house prices). The composite 20, in real terms, is 2% above the bubble peak.
People usually graph nominal house prices, but it is also important to look at prices in real terms. As an example, if a house price was $300,000 in January 2010, the price would be $432,000 today adjusted for inflation (44% increase). That is why the second graph below is important - this shows "real" prices.
The third graph shows the price-to-rent ratio, and the fourth graph is the affordability index. The last graph shows the 5-year real return based on the Case-Shiller National Index.
...
The second graph shows the same two indexes in real terms (adjusted for inflation using CPI).
In real terms (using CPI), the National index is 1.9% below the recent peak, and the Composite 20 index is 2.5% below the recent peak in 2022. Both indexes increased slightly in May in real terms.

Construction Spending Decreased 0.3% in June
by Calculated Risk on 8/01/2024 10:30:00 AM
From the Census Bureau reported that overall construction spending decreased:
Construction spending during June 2024 was estimated at a seasonally adjusted annual rate of $2,148.4 billion, 0.3 percent below the revised May estimate of $2,154.8 billion. The June figure is 6.2 percent above the June 2023 estimate of $2,023.0 billion.Both private and public spending decreased:
emphasis added
pending on private construction was at a seasonally adjusted annual rate of $1,664.6 billion, 0.3 percent below the revised May estimate of $1,668.8 billion. ...
In June, the estimated seasonally adjusted annual rate of public construction spending was $483.9 billion, 0.4 percent below the revised May estimate of $486.0 billion.
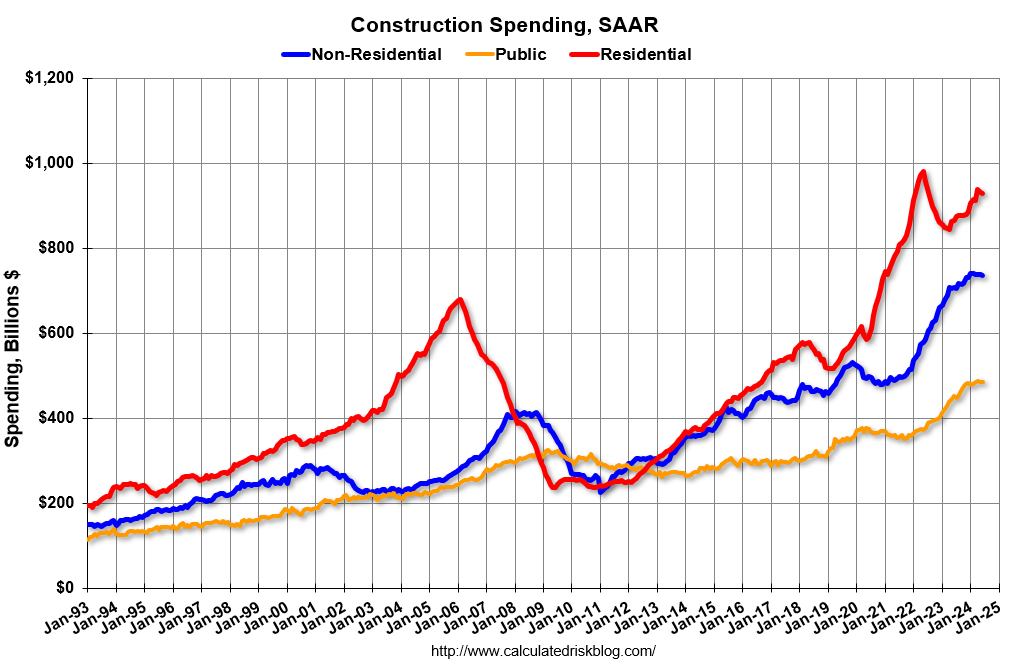 Click on graph for larger image.
This graph shows private residential and nonresidential construction spending, and public spending, since 1993. Note: nominal dollars, not inflation adjusted.
Residential (red) spending is 5.4% below the recent peak in 2022.
Non-residential (blue) spending is 0.4% below the peak in January 2024.
Public construction spending is 0.6% below the peak in April 2024.
 The second graph shows the year-over-year change in construction spending.
On a year-over-year basis, private residential construction spending is up 7.3%. Non-residential spending is up 4.2% year-over-year. Public spending is up 7.3% year-over-year.
This was below consensus expectations for 0.2% increase in spending, however, total construction spending for the previous two months was revised up.
This is probably just the start of weakness for private non-residential construction.
ISM® Manufacturing index Decreased to 46.8% in July
by Calculated Risk on 8/01/2024 10:00:00 AM
(Posted with permission). The ISM manufacturing index indicated expansion. The PMI® was at 46.8% in July, down from 48.5% in June. The employment index was at 43.4%, down from 49.3% the previous month, and the new orders index was at 47.1%, down from 49.3%.
From ISM: Manufacturing PMI® at 46.8% July 2024 Manufacturing ISM® Report On Business®
Economic activity in the manufacturing sector contracted in July for the fourth consecutive month and the 20th time in the last 21 months, say the nation's supply executives in the latest Manufacturing ISM® Report On Business®.This suggests manufacturing contracted in July. This was below the consensus forecast.
The report was issued today by Timothy R. Fiore, CPSM, C.P.M., Chair of the Institute for Supply Management® (ISM®) Manufacturing Business Survey Committee:
“The Manufacturing PMI® registered 46.8 percent in July, down 1.7 percentage points from the 48.5 percent recorded in June. The overall economy continued in expansion for the 51st month after one month of contraction in April 2020. (A Manufacturing PMI® above 42.5 percent, over a period of time, generally indicates an expansion of the overall economy.) The New Orders Index remained in contraction territory, registering 47.4 percent, 1.9 percentage points lower than the 49.3 percent recorded in June. The July reading of the Production Index (45.9 percent) is 2.6 percentage points lower than June’s figure of 48.5 percent. The Prices Index registered 52.9 percent, up 0.8 percentage point compared to the reading of 52.1 percent in June. The Backlog of Orders Index registered 41.7 percent, equaling its June reading. The Employment Index registered 43.4 percent, down 5.9 percentage points from June’s figure of 49.3 percent.
emphasis added

In Memoriam: Doris "Tanta" Dungey


| Privacy Policy |
| Copyright © 2007 - 2025 CR4RE LLC |
| Excerpts NOT allowed on x.com |