 RSS Feed
 by Calculated Risk on 9/09/2024 09:08:00 AM
Monday, September 09, 2024
Wholesale Used Car Prices Increased in August; Down 3.9% Year-over-year
From Manheim Consulting today: Wholesale Used-Vehicle Prices Increased in August
Wholesale used-vehicle prices (on a mix, mileage, and seasonally adjusted basis) were higher in August compared to July. The Manheim Used Vehicle Value Index (MUVVI) rose to 203.9, a decline of 3.9% from a year ago. The seasonal adjustment to the index mitigated the impact on the month, resulting in values that rose 1.2% month over month. The non-adjusted price in August increased by 2.2% compared to July, moving the unadjusted average price down 4.6% year over year.
emphasis added
 Click on graph for larger image.
This index from Manheim Consulting is based on all completed sales transactions at Manheim’s U.S. auctions.
The Manheim index suggests used car prices increased in August (seasonally adjusted) and were down 3.9% year-over-year (YoY).
Housing Sept 9th Weekly Update: Inventory Down 0.1% Week-over-week, Up 38.0% Year-over-year
by Calculated Risk on 9/09/2024 08:17:00 AM
Altos reports that active single-family inventory was down 0.1% week-over-week. Inventory is now up 42.4% from the February seasonal bottom.
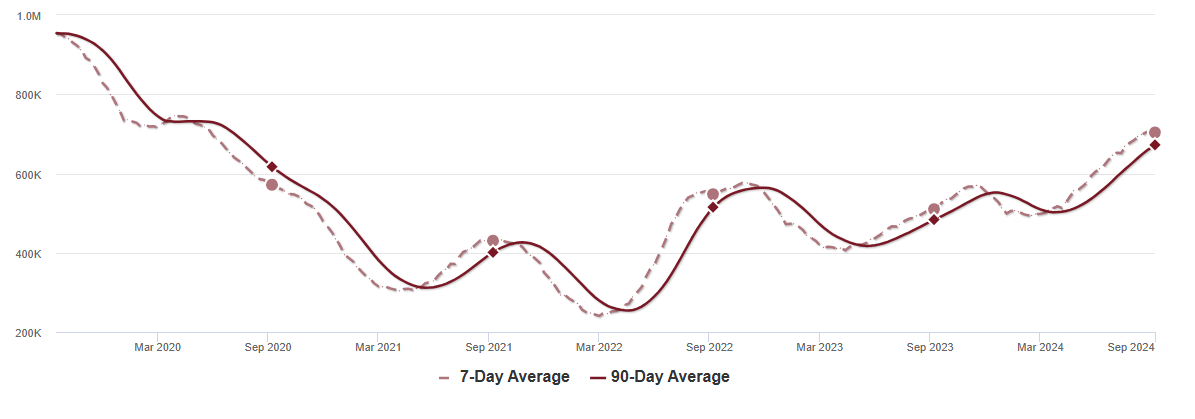 Click on graph for larger image.
This inventory graph is courtesy of Altos Research.
As of September 6th, inventory was at 704 thousand (7-day average), compared to 704 thousand the prior week.
It is possible inventory is at or close to the peak for the year (this would be normal timing pre-pandemic).
The second graph shows the seasonal pattern for active single-family inventory since 2015.

The red line is for 2024. The black line is for 2019.
Inventory was up 38.0% compared to the same week in 2023 (last week it was up 38.2%), and down 25.7% compared to the same week in 2019 (last week it was down 26.6%).
Back in June 2023, inventory was down almost 54% compared to 2019, so the gap to more normal inventory levels is slowly closing.
Mike Simonsen discusses this data regularly on Youtube.
Sunday, September 08, 2024
Sunday Night Futures
by Calculated Risk on 9/08/2024 07:33:00 PM
Weekend:
• Schedule for Week of September 8, 2024
• House Price Weekend: Case-Shiller: National House Price Index Up 5.4% year-over-year in June
• Inflation Adjusted House Prices 1.6% Below 2022 Peak
• Freddie Mac House Price Index Increased Slightly in July; Up 4.4% Year-over-year
Monday:
• No major economic releases scheduled.
From CNBC: Pre-Market Data and Bloomberg futures S&P 500 are down 4 and DOW futures are down 32 (fair value).
Oil prices were up mostly unchanged over the last week with WTI futures at $67.67 per barrel and Brent at $71.06 per barrel. A year ago, WTI was at $88, and Brent was at $92 - so WTI oil prices are down about 24% year-over-year.
Here is a graph from Gasbuddy.com for nationwide gasoline prices. Nationally prices are at $3.24 per gallon. A year ago, prices were at $3.80 per gallon, so gasoline prices are down $0.56 year-over-year.
Freddie Mac House Price Index Increased Slightly in July; Up 4.4% Year-over-year
by Calculated Risk on 9/08/2024 12:15:00 PM
Today, in the Calculated Risk Real Estate Newsletter: Freddie Mac House Price Index Increased Slightly in July; Up 4.4% Year-over-year
A brief excerpt:
Freddie Mac reported that its “National” Home Price Index (FMHPI) increased 0.05% month-over-month on a seasonally adjusted (SA) basis in June. On a year-over-year basis, the National FMHPI was up 4.4% in July, down from up 5.2% YoY in June. The YoY increase peaked at 19.1% in July 2021, and for this cycle, bottomed at up 0.9% YoY in May 2023. ...
As of July, 17 states and D.C. were below their previous peaks, Seasonally Adjusted. The largest seasonally adjusted declines from the recent peak were in Idaho (-4.2%), Arizona (-1.9%), Arkansas (-1.8), Florida (-1.6%), Texas (-1.3%), and Colorado (-1.1%).
For cities (Core-based Statistical Areas, CBSA), here are the 30 cities with the largest declines from the peak, seasonally adjusted. Austin continues to be the worst performing city. However, 10 of the 30 worst performing cities are now in Florida!

There is much more in the article.
Inflation Adjusted House Prices 1.6% Below 2022 Peak; Price-to-rent index is 7.7% below 2022 peak
by Calculated Risk on 9/08/2024 10:52:00 AM
Today, in the Calculated Risk Real Estate Newsletter: Inflation Adjusted House Prices 1.9% Below 2022 Peak
Excerpt:
It has been over 18 years since the bubble peak. In the June Case-Shiller house price index released last week, the seasonally adjusted National Index (SA), was reported as being 73% above the bubble peak in 2006. However, in real terms, the National index (SA) is about 11% above the bubble peak (and historically there has been an upward slope to real house prices). The composite 20, in real terms, is 2% above the bubble peak.
People usually graph nominal house prices, but it is also important to look at prices in real terms. As an example, if a house price was $300,000 in January 2010, the price would be $432,000 today adjusted for inflation (44% increase). That is why the second graph below is important - this shows "real" prices.
The third graph shows the price-to-rent ratio, and the fourth graph is the affordability index. The last graph shows the 5-year real return based on the Case-Shiller National Index.
...
The second graph shows the same two indexes in real terms (adjusted for inflation using CPI).
In real terms (using CPI), the National index is 1.6% below the recent peak, and the Composite 20 index is 2.0% below the recent peak in 2022. Both indexes increased in June in real terms boosted by the slight month-over-month decline in inflation in June.

Saturday, September 07, 2024
Case-Shiller: National House Price Index Up 5.4% year-over-year in June; FHFA House Price Index Declined Slightly month-over-month in June
by Calculated Risk on 9/07/2024 06:50:00 PM
Today, in the Calculated Risk Real Estate Newsletter: House Price Weekend: Case-Shiller: National House Price Index Up 5.4% year-over-year in June
Excerpt:
S&P/Case-Shiller released the monthly Home Price Indices for June ("June" is a 3-month average of April, May and June closing prices). June closing prices include some contracts signed in February, so there is a significant lag to this data. Here is a graph of the month-over-month (MoM) change in the Case-Shiller National Index Seasonally Adjusted (SA).
The MoM increase in the seasonally adjusted (SA) Case-Shiller National Index was at 0.16%. This was the seventeenth consecutive MoM increase, but this was the smallest MoM increase in the last 16 months.
On a seasonally adjusted basis, prices increased month-to-month in 15 of the 20 Case-Shiller cities. Seasonally adjusted, San Francisco has fallen 6.8% from the recent peak, Phoenix is down 4.5% from the peak, Seattle down 4.0%, and Portland is down 3.4%.

There is much more in the article.
Schedule for Week of September 8, 2024
by Calculated Risk on 9/07/2024 08:11:00 AM
The key economic report this week is the August Consumer Price Index (CPI).
No major economic releases scheduled.
6:00 AM: NFIB Small Business Optimism Index for August.
8:00 AM: Corelogic House Price index for July
7:00 AM ET: The Mortgage Bankers Association (MBA) will release the results for the mortgage purchase applications index.
8:30 AM: The Consumer Price Index for August from the BLS. The consensus is for a 0.2% increase in CPI, and a 0.2% increase in core CPI. The consensus is for CPI to be up 2.6% year-over-year (down from 2.9% in July) and core CPI to be up 3.2% YoY (unchanged from 3.2% in July).
8:30 AM: The initial weekly unemployment claims report will be released. The consensus is for 225 thousand initial claims, down from 227 thousand last week.
8:30 AM: The Producer Price Index for August from the BLS. The consensus is for a 0.2% increase in PPI, and a 0.2% increase in core PPI.
12:00 PM: Q2 Flow of Funds Accounts of the United States from the Federal Reserve.
10:00 AM: University of Michigan's Consumer sentiment index (Preliminary for September).
Friday, September 06, 2024
September 6th COVID Update: Wastewater Measure Has Peaked
by Calculated Risk on 9/06/2024 07:31:00 PM
 Note: Mortgage rates are from MortgageNewsDaily.com and are for top tier scenarios.
For deaths, I'm currently using 4 weeks ago for "now", since the most recent three weeks will be revised significantly.
Note: "Effective May 1, 2024, hospitals are no longer required to report COVID-19 hospital admissions, hospital capacity, or hospital occupancy data." So I'm no longer tracking hospitalizations.
| COVID Metrics | ||||
|---|---|---|---|---|
| Now | Week Ago | Goal | ||
| Deaths per Week🚩 | 971 | 891 | ≤3501 | |
| 1my goals to stop weekly posts, 🚩 Increasing number weekly for Deaths ✅ Goal met. | ||||
 Click on graph for larger image.
This graph shows the weekly (columns) number of deaths reported.
Although weekly deaths met the original goal to stop posting, I'm going to continue to post now that deaths are above the goal again.
Weekly deaths are triple the low of 302 in early June.
 This appears to be a leading indicator for COVID hospitalizations and deaths.
COVID in wastewater turned down in most areas recently and this suggests weekly deaths will likely decline in a few weeks (until the winter surge).
Q3 GDP Tracking: Low-to-Mid 2%
by Calculated Risk on 9/06/2024 06:17:00 PM
From BofA:
Since our last weekly publication, the 3Q GDP tracking estimate went down three tenths to 2.3% q/q saar while our 2Q GDP tracking estimate remains unchanged at 3.0% q/q saar since the second official estimate. [Sept 6th estimate]From Goldman:
emphasis added
The details of the trade balance report were somewhat softer than our previous assumptions while the details of the factory orders report were roughly in line with our expectations. On net, we lowered our Q3 GDP tracking estimate by 0.2pp to +2.5% (quarter-over-quarter annualized) and left our Q3 domestic final sales forecast unchanged at 2.6%. [Sept 4th estimate]And from the Atlanta Fed: GDPNow
The GDPNow model estimate for real GDP growth (seasonally adjusted annual rate) in the third quarter of 2024 is 2.1 percent on September 4, up from 2.0 percent on September 3. After this morning’s releases from the US Census Bureau, an increase in the nowcast of third-quarter real gross private domestic investment growth from -0.6 percent to 0.0 percent was slightly offset by a decrease in the nowcast of third-quarter real personal consumption expenditures growth from 3.3 percent to 3.2 percent. [Sept 4th estimate]
Catching Up: New Home Sales Increased to 739,000 Annual Rate in July
by Calculated Risk on 9/06/2024 12:03:00 PM
Today, in the Calculated Risk Real Estate Newsletter: Catching Up: New Home Sales Increased to 739,000 Annual Rate in July
Brief excerpt:
I'm back from Africa! I’ll be catching up on recent data over the next few days, and I’ll post some photos / videos from my trip.There is much more in the article.
...
Last week the Census Bureau reported New Home Sales in July were at a seasonally adjusted annual rate (SAAR) of 739 thousand. The previous three months were revised up sharply, combined.
...
The next graph shows new home sales for 2023 and 2024 by month (Seasonally Adjusted Annual Rate). Sales in July 2024 were up 21.3% from July 2023.
New home sales, seasonally adjusted, have increased year-over-year in 15 of the last 16 months.


