 RSS Feed
 by Calculated Risk on 9/10/2024 03:54:00 PM
Tuesday, September 10, 2024
CoreLogic: US Home Prices Increased 4.3% Year-over-year in July, "Notable Cooling"
Notes: This CoreLogic House Price Index report is for July. The recent Case-Shiller index release was for June. The CoreLogic HPI is a three-month weighted average and is not seasonally adjusted (NSA).
From CoreLogic: CoreLogic: Annual US Home Price Growth Dips Below 5% as Summer Brings Notable Cooling to the Housing Market
• U.S. home prices posted a 4.3% year-over-year gain in July, with no states posting double-digit gains.This was a smaller YoY increase than reported for May, and down from the 5.8% YoY increase reported at the beginning of 2024.
• Home prices showed no gains in July compared with the month before – the first July since 2010 that home prices didn’t increase outside the 2022 declines following a surge in mortgage rates
• By August, home prices are forecast to rise only 0.2% as the summer slowdown continues.
• Miami once again took the lead as the metro with the greatest price growth among the top 10 largest metros
...
U.S. year-over-year home price gains inched down, reaching 4.3% in July, falling further from the previous month’s 4.7% and resting below 5% for the third consecutive month. On a month-over-month basis, home prices decreased by 0.01% in July 2024 compared with June 2024. We will likely see home prices continue to slide for the remainder of the year as sales across the country slow. Although July marked the 150th consecutive month of annual growth, monthly home price growth is starting to slip, and annual forecasts are showing smaller anticipated gains. By August, home prices are forecast to rise only 0.2%, and next year, prices will inch up by 2.2%.
Much of this sluggishness can be attributed to high mortgage interest rates that are continuing to challenge the housing market. As buyers remain cautious, sales remain low. However, the highly anticipated rate cuts from the Federal Reserve this fall may help improve consumer purchase sentiment for the housing market.
“Housing demand continued to buckle under the pressure of high mortgage rates and unaffordable home prices, leading to a considerable slowing of home price gains during the summer. July’s prices were essentially flat from the month before, which was notably cooler than the average gain of 0.4% recorded between June and July in years prior to the pandemic and especially during the pandemic,” said Dr. Selma Hepp chief economist for CoreLogic. “The question for home prices going forward is whether the upcoming rate cut from the Fed and expected continuation of falling mortgage rates will be sufficient to motivate potential homebuyers who may start to fear cooling labor market and continued uncertainty of a soft landing, along with anticipation around the presidential election. And while lower mortgage rates are a boost to affordability and are likely to help buyer demand, the usual fall housing market slowdown is upon us and is likely to contain any significant surge in activity.”
emphasis added
Update: Lumber Prices Unchanged YoY
by Calculated Risk on 9/10/2024 01:52:00 PM
Here is another monthly update on lumber prices.
SPECIAL NOTE: The CME group discontinued the Random Length Lumber Futures contract on May 16, 2023. I switched to a physically-delivered Lumber Futures contract that was started in August 2022.
Unfortunately, this impacts long term price comparisons since the new contract was priced about 24% higher than the old random length contract for the period when both contracts were available.
This graph shows CME random length framing futures through last August (blue), and the new physically-delivered Lumber Futures (LBR) contract starting in August 2022 (Red).
 Click on graph for larger image.
We didn't see a significant runup in the Spring period of 2023 or 2024 due to the housing slowdown.
This graph shows CME random length framing futures through last August (blue), and the new physically-delivered Lumber Futures (LBR) contract starting in August 2022 (Red).
LBR is currently at $505 per 1000 board feet, up slightly from a year ago.
 Click on graph for larger image.
There is somewhat of a seasonal demand for lumber, and lumber prices frequently peak in the first half of the year.
We didn't see a significant runup in the Spring period of 2023 or 2024 due to the housing slowdown.
Leading Index for Commercial Real Estate Increased 3% in August
by Calculated Risk on 9/10/2024 11:22:00 AM
From Dodge Data Analytics: Dodge Momentum Index Rises 3% in August
The Dodge Momentum Index (DMI), issued by Dodge Construction Network, increased 2.9% in August to 220.4 (2000=100) from the revised July reading of 214.2. Over the month, commercial planning expanded 1.9% and institutional planning improved 5.7%.
“Owners and developers continued to prime the planning queue in August, ahead of next year’s anticipated stronger market conditions,” stated Sarah Martin, associate director of forecasting at Dodge Construction Network. “With the Fed’s September rate cut all but finalized, the influence of selective lending standards and inflation should moderate next year, alongside a modest upgrade to consumer demand. As a result, stronger planning activity was widespread in August, with most nonresidential sectors seeing growth.”
Commercial planning saw another month of broad-based improvements. After slowing down in recent years, warehouse projects have gained momentum over the last three months. Hotels and retail planning have been steadily expanding as well. Data centers continued to dominate large project activity, but the rate at which planning projects entered the queue in August moderated after several months of very strong growth. On the institutional side, healthcare was the primary driver of this past month’s expansion, followed by recreational planning. In August, the DMI was 31% higher than in August of 2023. The commercial segment was up 42% from year-ago levels, while the institutional segment was up 8% over the same period.
...
The DMI is a monthly measure of the value of nonresidential building projects going into planning, shown to lead construction spending for nonresidential buildings by a full year.
emphasis added
 Click on graph for larger image.
This graph shows the Dodge Momentum Index since 2002. The index was at 220.4 in August, up from 214.2 the previous month.
According to Dodge, this index leads "construction spending for nonresidential buildings by a full year". This index suggests a slowdown in 2024 and early 2025, but a pickup in mid-2025.
Commercial construction is typically a lagging economic indicator.
ICE Mortgage Monitor: House Price Growth Slows, Inventory Surges in Florida and Texas
by Calculated Risk on 9/10/2024 08:22:00 AM
Today, in the Real Estate Newsletter: ICE Mortgage Monitor: House Price Growth Slows, Inventory Surges in Florida and Texas
Brief excerpt:
The local data I track is indicating that Florida and Texas inventory is above normal, whereas inventory is still low in most of the country.
• Every major market has more inventory for sale that at the same time last year, with the largest improvements in the state of Florida, along with individual markets, including Denver, Seattle, and parts of Texas
• More than 1 in 5 markets are now back to, or above, 2017-2019 inventory levels, with markets like Lakeland, Austin, San Antonio, Denver, and Palm Bay all having at least 25% more homes for sale than typical for this time of year

Monday, September 09, 2024
Tuesday: Misc
by Calculated Risk on 9/09/2024 07:13:00 PM
 From Matthew Graham at Mortgage News Daily: Mortgage Rates Holding Near Long-Term Lows to Start New Week
The average lender's top tier 30yr fixed rate fell to the lowest level since April 2023 last week. That's down more than 1.25% over the past 5 months. ... Today brought a significantly smaller improvement, but an improvement on a long-term low technically makes another long-term low.[30 year fixed 6.55%]Tuesday:
emphasis added
• At 6:00 AM ET, NFIB Small Business Optimism Index for August.
• At 8:00 AM, Corelogic House Price index for July
1st Look at Local Housing Markets in August
by Calculated Risk on 9/09/2024 11:30:00 AM
Today, in the Calculated Risk Real Estate Newsletter: 1st Look at Local Housing Markets in August
A brief excerpt:
NOTE: The tables for active listings, new listings and closed sales all include a comparison to August 2019 for each local market (some 2019 data is not available).There is much more in the article.
This is the first look at several early reporting local markets in August. I’m tracking over 40 local housing markets in the US. Some of the 40 markets are states, and some are metropolitan areas. I’ll update these tables throughout the month as additional data is released.
Closed sales in August were mostly for contracts signed in June and July when 30-year mortgage rates averaged 6.92% and 6.85%, respectively (Freddie Mac PMMS).
...
In August, sales in these markets were up 6.6% YoY. Last month, in July, these same markets were up 5.8% year-over-year Not Seasonally Adjusted (NSA).
Important: There was one fewer working day in August 2024 compared to August 2023 (22 vs 23), so seasonally adjusted sales up be up more than NSA sales. Last month, in July 2024, there were two more working days compared to July 2023 (22 vs 20), so seasonally adjusted sales were lower than the NSA data suggests.
Sales in all of these markets are down significantly compared to July 2019.
...
This was just a several early reporting markets. Many more local markets to come!

Wholesale Used Car Prices Increased in August; Down 3.9% Year-over-year
by Calculated Risk on 9/09/2024 09:08:00 AM
From Manheim Consulting today: Wholesale Used-Vehicle Prices Increased in August
Wholesale used-vehicle prices (on a mix, mileage, and seasonally adjusted basis) were higher in August compared to July. The Manheim Used Vehicle Value Index (MUVVI) rose to 203.9, a decline of 3.9% from a year ago. The seasonal adjustment to the index mitigated the impact on the month, resulting in values that rose 1.2% month over month. The non-adjusted price in August increased by 2.2% compared to July, moving the unadjusted average price down 4.6% year over year.
emphasis added
 Click on graph for larger image.
This index from Manheim Consulting is based on all completed sales transactions at Manheim’s U.S. auctions.
The Manheim index suggests used car prices increased in August (seasonally adjusted) and were down 3.9% year-over-year (YoY).
Housing Sept 9th Weekly Update: Inventory Down 0.1% Week-over-week, Up 38.0% Year-over-year
by Calculated Risk on 9/09/2024 08:17:00 AM
Altos reports that active single-family inventory was down 0.1% week-over-week. Inventory is now up 42.4% from the February seasonal bottom.
 Click on graph for larger image.
This inventory graph is courtesy of Altos Research.
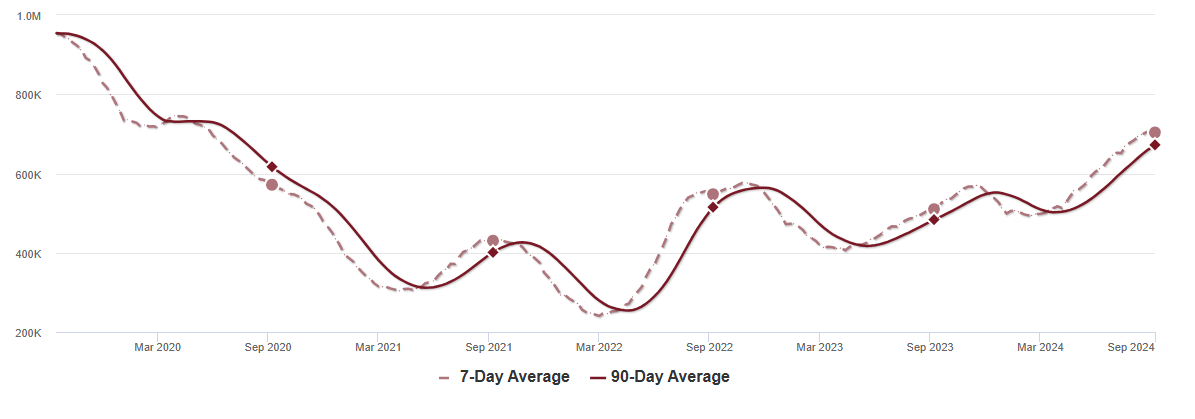
As of September 6th, inventory was at 704 thousand (7-day average), compared to 704 thousand the prior week.
It is possible inventory is at or close to the peak for the year (this would be normal timing pre-pandemic).
The second graph shows the seasonal pattern for active single-family inventory since 2015.

The red line is for 2024. The black line is for 2019.
Inventory was up 38.0% compared to the same week in 2023 (last week it was up 38.2%), and down 25.7% compared to the same week in 2019 (last week it was down 26.6%).
Back in June 2023, inventory was down almost 54% compared to 2019, so the gap to more normal inventory levels is slowly closing.
Mike Simonsen discusses this data regularly on Youtube.
Sunday, September 08, 2024
Sunday Night Futures
by Calculated Risk on 9/08/2024 07:33:00 PM
Weekend:
• Schedule for Week of September 8, 2024
• House Price Weekend: Case-Shiller: National House Price Index Up 5.4% year-over-year in June
• Inflation Adjusted House Prices 1.6% Below 2022 Peak
• Freddie Mac House Price Index Increased Slightly in July; Up 4.4% Year-over-year
Monday:
• No major economic releases scheduled.
From CNBC: Pre-Market Data and Bloomberg futures S&P 500 are down 4 and DOW futures are down 32 (fair value).
Oil prices were up mostly unchanged over the last week with WTI futures at $67.67 per barrel and Brent at $71.06 per barrel. A year ago, WTI was at $88, and Brent was at $92 - so WTI oil prices are down about 24% year-over-year.
Here is a graph from Gasbuddy.com for nationwide gasoline prices. Nationally prices are at $3.24 per gallon. A year ago, prices were at $3.80 per gallon, so gasoline prices are down $0.56 year-over-year.
Freddie Mac House Price Index Increased Slightly in July; Up 4.4% Year-over-year
by Calculated Risk on 9/08/2024 12:15:00 PM
Today, in the Calculated Risk Real Estate Newsletter: Freddie Mac House Price Index Increased Slightly in July; Up 4.4% Year-over-year
A brief excerpt:
Freddie Mac reported that its “National” Home Price Index (FMHPI) increased 0.05% month-over-month on a seasonally adjusted (SA) basis in June. On a year-over-year basis, the National FMHPI was up 4.4% in July, down from up 5.2% YoY in June. The YoY increase peaked at 19.1% in July 2021, and for this cycle, bottomed at up 0.9% YoY in May 2023. ...
As of July, 17 states and D.C. were below their previous peaks, Seasonally Adjusted. The largest seasonally adjusted declines from the recent peak were in Idaho (-4.2%), Arizona (-1.9%), Arkansas (-1.8), Florida (-1.6%), Texas (-1.3%), and Colorado (-1.1%).
For cities (Core-based Statistical Areas, CBSA), here are the 30 cities with the largest declines from the peak, seasonally adjusted. Austin continues to be the worst performing city. However, 10 of the 30 worst performing cities are now in Florida!

There is much more in the article.


