 RSS Feed
 by Calculated Risk on 9/12/2024 07:06:00 PM
Thursday, September 12, 2024
Friday: Misc
 Note: Mortgage rates are from MortgageNewsDaily.com and are for top tier scenarios.
Friday:
• At 10:00 AM: University of Michigan's Consumer sentiment index (Preliminary for September).
Realtor.com Reports Active Inventory Up 33.4% YoY
by Calculated Risk on 9/12/2024 04:30:00 PM
What this means: On a weekly basis, Realtor.com reports the year-over-year change in active inventory and new listings. On a monthly basis, they report total inventory. For August, Realtor.com reported inventory was up 5.8% YoY, but still down 26.4% compared to the 2017 to 2019 same month levels.
Now - on a weekly basis - inventory is up 33.4% YoY.
Realtor.com has monthly and weekly data on the existing home market. Here is their weekly report: Weekly Housing Trends View—Data for Week Ending Sept. 7, 2024 Here is a graph of the year-over-year change in inventory according to realtor.com.
Inventory was up year-over-year for the 44th consecutive week.
Realtor.com has monthly and weekly data on the existing home market. Here is their weekly report: Weekly Housing Trends View—Data for Week Ending Sept. 7, 2024
• Active inventory increased, with for-sale homes 33.4% above year-ago levels
For the 44th consecutive week dating to November 2023, the number of listings for sale has grown year over year, and this week continues a string of growth rates in the mid-30% range that started in April. This is a slight decrease from last week’s gain of 34.6%.
• New listings—a measure of sellers putting homes up for sale—ticked higher this week by 9.9% from one year ago
The recent easing of mortgage rates has encouraged many sellers to return to the market, with the year-over-year growth in new listings experiencing its largest increase in a month. What’s more, the rate was nearly double last week’s gain of 5.5%.
 Here is a graph of the year-over-year change in inventory according to realtor.com.
 Inventory was up year-over-year for the 44th consecutive week.
However, inventory is still historically low.
New listings remain below typical pre-pandemic levels.
The "Home ATM" Mostly Closed in Q2
by Calculated Risk on 9/12/2024 12:58:00 PM
Today, in the Real Estate Newsletter: The "Home ATM" Mostly Closed in Q2
Excerpt:
During the housing bubble, many homeowners borrowed heavily against their perceived home equity - jokingly calling it the “Home ATM” - and this contributed to the subsequent housing bust, since so many homeowners had negative equity in their homes when house prices declined.There is much more in the article. You can subscribe at https://calculatedrisk.substack.com/.
Unlike during the housing bubble, very few homeowners have negative equity now. From CoreLogic this morning: Homeowner Equity Insights – Q2 2024The report shows that U.S. homeowners with mortgages (which account for roughly 62% of all properties) saw home equity increase by 8.0% year over year, representing a collective gain of $1.3 trillion and an average increase of $25,000 per borrower since the second quarter of 2023, bringing the total net homeowner equity to over $17.6 trillion in the second quarter of 2024. …
From the second quarter of 2023 to the second quarter of 2024, the total number of mortgaged homes in negative equity decreased by 4.2%, to 1 million homes or 1.7% of all mortgaged properties.Here is the quarterly increase in mortgage debt from the Federal Reserve’s Financial Accounts of the United States - Z.1 (sometimes called the Flow of Funds report) released today. In the mid ‘00s, there was a large increase in mortgage debt associated with the housing bubble.
In Q2 2024, mortgage debt increased $99 billion, up from $31 billion in Q1, and down from the cycle peak of $467 billion in Q2 2021. Note the almost 7 years of declining mortgage debt as distressed sales (foreclosures and short sales) wiped out a significant amount of debt.
However, some of this debt is being used to increase the housing stock (purchase new homes), so this isn’t all Mortgage Equity Withdrawal (MEW).

Fed's Flow of Funds: Household Net Worth Increased $2.8 Trillion in Q2
by Calculated Risk on 9/12/2024 12:29:00 PM
The Federal Reserve released the Q2 2024 Flow of Funds report today: Financial Accounts of the United States.
The net worth of households and nonprofits rose to $163.8 trillion during the second quarter of 2024. The value of directly and indirectly held corporate equities increased $0.7 trillion and the value of real estate increased $1.8 trillion.
...
Household debt increased 3.2 percent at an annual rate in the second quarter of 2024. Consumer credit grew at an annual rate of 1.6 percent, while mortgage debt (excluding charge-offs) grew at an annual rate of 3 percent.
 Click on graph for larger image.
The first graph shows Households and Nonprofit net worth as a percent of GDP.
Net worth increased $2.8 trillion in Q2 to an all-time high. As a percent of GDP, net worth increased in Q2, but is below the peak in 2021.
This includes real estate and financial assets (stocks, bonds, pension reserves, deposits, etc.) net of liabilities (mostly mortgages). Note that this does NOT include public debt obligations.
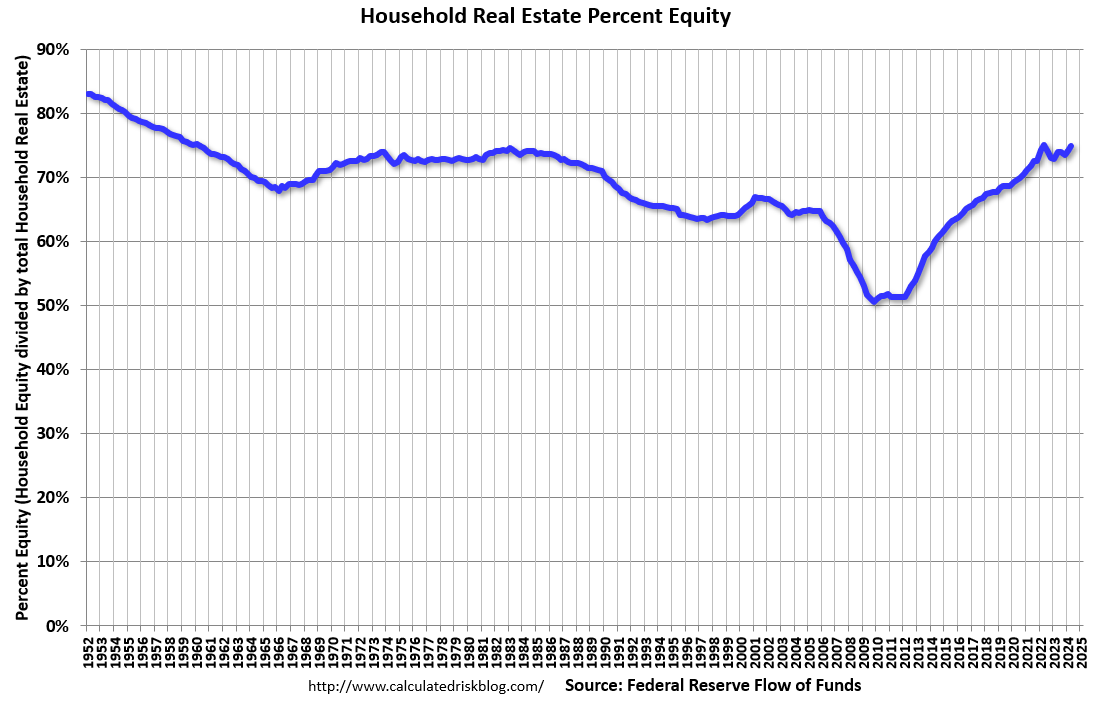
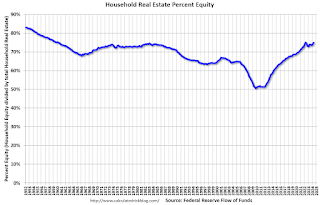 The second graph shows homeowner percent equity since 1952.
Household percent equity (as measured by the Fed) collapsed when house prices fell sharply in 2007 and 2008.
In Q2 2024, household percent equity (of household real estate) was at 74.9% - up from 74.2% in Q1, 2024. This is close to the highest percent equity since the 1960s.
Note: This includes households with no mortgage debt.
 The third graph shows household real estate assets and mortgage debt as a percent of GDP.
Mortgage debt increased by $98 billion in Q2.
Mortgage debt is up $2.34 trillion from the peak during the housing bubble, but, as a percent of GDP is at 45.9% - down from Q1 - and down from a peak of 73.3% of GDP during the housing bust.
The value of real estate, as a percent of GDP, increased in Q2 - but is below the peak in Q2 2022, and is well above the average of the last 30 years.
 The second graph shows homeowner percent equity since 1952.
 Household percent equity (as measured by the Fed) collapsed when house prices fell sharply in 2007 and 2008.
In Q2 2024, household percent equity (of household real estate) was at 74.9% - up from 74.2% in Q1, 2024. This is close to the highest percent equity since the 1960s.
Note: This includes households with no mortgage debt.
 The third graph shows household real estate assets and mortgage debt as a percent of GDP.
 Mortgage debt increased by $98 billion in Q2.
Mortgage debt is up $2.34 trillion from the peak during the housing bubble, but, as a percent of GDP is at 45.9% - down from Q1 - and down from a peak of 73.3% of GDP during the housing bust.
The value of real estate, as a percent of GDP, increased in Q2 - but is below the peak in Q2 2022, and is well above the average of the last 30 years.
CoreLogic: 1.11 million Homeowners with Negative Equity in Q2 2024
by Calculated Risk on 9/12/2024 09:51:00 AM
From CoreLogic: CoreLogic: US Homeowners See Equity Gains Continue to Climb, but at a Slower Pace in Q2
CoreLogic® ... today released the Homeowner Equity Report (HER) for the second quarter of 2024. The report shows that U.S. homeowners with mortgages (which account for roughly 62% of all properties) saw home equity increase by 8.0% year over year, representing a collective gain of $1.3 trillion and an average increase of $25,000 per borrower since the second quarter of 2023, bringing the total net homeowner equity to over $17.6 trillion in the second quarter of 2024.The above graph is from CoreLogic and compares Q2 2024 to Q1 2024 equity distribution by LTV. There are still a few properties with LTV over 125%. But most homeowners have a significant amount of equity.
...
“Persistent home price growth has continued to fuel home equity gains for existing homeowners who now average about $315,000 in equity and almost $129,000 more than at the onset of the pandemic.” said Dr. Selma Hepp, chief economist for CoreLogic. “The substantial accumulation of home equity for existing homeowners has served as an important financial buffer in times of uncertainty, as some homeowners facing higher costs of homeowners’ insurance and taxes and have had to tap into their equity to prevent falling behind on their mortgages. As a result, mortgage delinquency rates have remained at historical lows despite the inflationary pressures and higher costs of almost all non-mortgage homeownership-related expenses.”
Negative equity, also referred to as underwater or upside-down mortgages, applies to borrowers who owe more on their mortgages than their homes are currently worth.
Negative equity has continued to see a recent decrease across the country. Las Vegas and Los Angeles are the least challenged, with negative equity shares of all mortgages at 0.6% and 0.7%, respectively.
As of the second quarter of 2024, the quarterly and annual changes in negative equity were:
Click on graph for larger image.
• Quarterly change: From the second quarter of 2023 to the second quarter of 2024, the total number of mortgaged homes in negative equity decreased by 4.2%, to 1 million homes or 1.7% of all mortgaged properties.
• Annual change: From the second quarter of 2023 to the first second of 2024, the total number of homes in negative equity decreased by 15%, to 1.1 million homes or 2.0% of all mortgaged properties.
emphasis added

 This is a very different picture than at the start of the housing bust when many homeowners had little equity.
The second graph is from a 2011 CoreLogic report and shows a large number of homeowners with negative equity - even as house prices were nearing a bottom!
On a year-over-year basis, the number of homeowners with negative equity has decreased to 1.11 million.
On a year-over-year basis, the number of homeowners with negative equity has decreased to 1.11 million.
Weekly Initial Unemployment Claims Increase to 230,000
by Calculated Risk on 9/12/2024 08:30:00 AM
The DOL reported:
In the week ending September 7, the advance figure for seasonally adjusted initial claims was 230,000, an increase of 2,000 from the previous week's revised level. The previous week's level was revised up by 1,000 from 227,000 to 228,000. The 4-week moving average was 230,750, an increase of 500 from the previous week's revised average. The previous week's average was revised up by 250 from 230,000 to 230,250.The following graph shows the 4-week moving average of weekly claims since 1971.
emphasis added
 Click on graph for larger image.
The dashed line on the graph is the current 4-week average. The four-week average of weekly unemployment claims increased to 230,750.
The previous week was revised up.
Weekly claims were above the consensus forecast.
Wednesday, September 11, 2024
Thursday: Unemployment Claims, PPI, Q2 Flow of Funds
by Calculated Risk on 9/11/2024 07:09:00 PM
 Note: Mortgage rates are from MortgageNewsDaily.com and are for top tier scenarios.
Thursday:
• At 8:30 AM ET, The initial weekly unemployment claims report will be released. The consensus is for 225 thousand initial claims, down from 227 thousand last week.
• At 8:30 AM, The Producer Price Index for August from the BLS. The consensus is for a 0.2% increase in PPI, and a 0.2% increase in core PPI.
• At 12:00 PM, Q2 Flow of Funds Accounts of the United States from the Federal Reserve.
Early Look at 2025 Cost-Of-Living Adjustments and Maximum Contribution Base
by Calculated Risk on 9/11/2024 04:02:00 PM
The BLS reported this morning:
The Consumer Price Index for Urban Wage Earners and Clerical Workers (CPI-W) increased 2.4 percent over the last 12 months to an index level of 308.640 (1982-84=100). For the month, the index was unchanged prior to seasonal adjustment.CPI-W is the index that is used to calculate the Cost-Of-Living Adjustments (COLA). The calculation dates have changed over time (see Cost-of-Living Adjustments), but the current calculation uses the average CPI-W for the three months in Q3 (July, August, September) and compares to the average for the highest previous average of Q3 months. Note: this is not the headline CPI-U and is not seasonally adjusted (NSA).
• In 2023, the Q3 average of CPI-W was 301.236.
The 2023 Q3 average was the highest Q3 average, so we only have to compare Q3 this year to last year.
 Click on graph for larger image.
This graph shows CPI-W since January 2000. The red lines are the Q3 average of CPI-W for each year.
Note: The year labeled is for the calculation, and the adjustment is effective for December of that year (received by beneficiaries in January of the following year).
CPI-W was up 2.4% year-over-year in August, and although this is early - we need the data for July, August and September - my guess is COLA will probably be around 2.4% this year, the smallest increase since 1.3% in 2021.
Contribution and Benefit Base
The contribution base will be adjusted using the National Average Wage Index. This is based on a one-year lag. The National Average Wage Index is not available for 2023 yet, although we know wages increased solidly in 2023. If wages increased 5% in 2023, then the contribution base next year will increase to around $177,000 in 2025, from the current $168,600.
Remember - this is an early look. What matters is average CPI-W, NSA, for all three months in Q3 (July, August and September).
Cleveland Fed: Median CPI increased 0.3% and Trimmed-mean CPI increased 0.2% in August
by Calculated Risk on 9/11/2024 12:17:00 PM
The Cleveland Fed released the median CPI and the trimmed-mean CPI.
According to the Federal Reserve Bank of Cleveland, the median Consumer Price Index rose 0.3% in August. The 16% trimmed-mean Consumer Price Index increased 0.2%. "The median CPI and 16% trimmed-mean CPI are measures of core inflation calculated by the Federal Reserve Bank of Cleveland based on data released in the Bureau of Labor Statistics’ (BLS) monthly CPI report".
 Click on graph for larger image.
This graph shows the year-over-year change for these four key measures of inflation.
Note: The Cleveland Fed released the median CPI details. Fuel oil and other fuels decreased at a 17% annual rate in August (and will likely decrease further in September).
According to the Federal Reserve Bank of Cleveland, the median Consumer Price Index rose 0.3% in August. The 16% trimmed-mean Consumer Price Index increased 0.2%. "The median CPI and 16% trimmed-mean CPI are measures of core inflation calculated by the Federal Reserve Bank of Cleveland based on data released in the Bureau of Labor Statistics’ (BLS) monthly CPI report".
 Click on graph for larger image.
This graph shows the year-over-year change for these four key measures of inflation.
On a year-over-year basis, the median CPI rose 4.2% (down from 4.2% in July, rounded), the trimmed-mean CPI rose 3.2% (down from 3.3%), and the CPI less food and energy rose 3.2% (unchanged from 3.2%).
Core PCE is for July was up 2.6% YoY, unchanged from 2.6% in June.
Note: The Cleveland Fed released the median CPI details. Fuel oil and other fuels decreased at a 17% annual rate in August (and will likely decrease further in September).
Rent and Owner's equivalent rent are still high, and if we exclude rent, median CPI would be around -1% month-over-month, annualized.
Asking Rents Mostly Unchanged Year-over-year
by Calculated Risk on 9/11/2024 09:44:00 AM
Today, in the Real Estate Newsletter: Asking Rents Mostly Unchanged Year-over-year
Brief excerpt:
Tracking rents is important for understanding the dynamics of the housing market. For example, the sharp increase in rents helped me deduce that there was a surge in household formation in 2021 (See from September 2021: Household Formation Drives Housing Demand). Now that household formation has slowed, and multi-family completions have increased, rents are under pressure....
Welcome to the September 2024 Apartment List National Rent Report. Our model captured an average rent decrease of -0.1% in August, and today the nationwide median rent stands at $1,412. This signals the end of the rental market’s annual busy season, as well as the second consecutive summer of modest rent growth, as the market remains sluggish thanks to a windfall of new supply. If historical trends hold, rents will continue to fall on a monthly basis for the remainder of the year.

Realtor.com: 12th Consecutive Month with Year-over-year Decline in Rents
In July 2024, the U.S. median rent continued to decline year over year for the 12th month in a row, down $12 (-0.7%) for 0-2 bedroom properties across the top 50 metros, faster than the rate of -0.4% seen in June 2024. The median asking rent was $1,741, down by $2 from last month, reflecting a similar seasonal trend as observed in the for-sale market.


