 RSS Feed
 by Calculated Risk on 9/19/2024 08:30:00 AM
Thursday, September 19, 2024
Weekly Initial Unemployment Claims Decrease to 219,000
The DOL reported:
In the week ending September 14, the advance figure for seasonally adjusted initial claims was 219,000, a decrease of 12,000 from the previous week's revised level. The previous week's level was revised up by 1,000 from 230,000 to 231,000. The 4-week moving average was 227,500, a decrease of 3,500 from the previous week's revised average. The previous week's average was revised up by 250 from 230,750 to 231,000.The following graph shows the 4-week moving average of weekly claims since 1971.
emphasis added
 Click on graph for larger image.
The dashed line on the graph is the current 4-week average. The four-week average of weekly unemployment claims increased to 230,750.
The previous week was revised up.
Weekly claims were below the consensus forecast.
Wednesday, September 18, 2024
Thursday: Unemployment Claims, Philly Fed Mfg, Existing Home Sales
by Calculated Risk on 9/18/2024 07:29:00 PM
 Note: Mortgage rates are from MortgageNewsDaily.com and are for top tier scenarios.
Thursday:
• At 8:30 AM ET, The initial weekly unemployment claims report will be released. The consensus is for 235 thousand initial claims, up from 230 thousand last week.
• Also at 8:30 AM, the Philly Fed manufacturing survey for September. The consensus is for a reading of 2.0, up from -7.0.
• At 10:00 AM, Existing Home Sales for August from the National Association of Realtors (NAR). The consensus is for 3.85 million SAAR, down from 3.95 million in July.
FOMC Projections
by Calculated Risk on 9/18/2024 02:12:00 PM
Statement here.
Fed Chair Powell press conference video here or on YouTube here, starting at 2:30 PM ET.
Here are the projections. Since the last projections were released, economic growth has been above expectations, the unemployment rate is slightly above expectations, and inflation lower than expected (although there are some "base effects" that might push PCE inflation up a little later this year).
In June, the FOMC participants’ midpoint of the target level for the federal funds rate was around 5.125% at the end of 2024. The FOMC participants’ midpoint of the target range is now at 4.5% at the end of 2024.
Market participants expect the target range to be around 4.25% at the end of 2024.
1 Projections of change in real GDP and inflation are from the fourth quarter of the previous year to the fourth quarter of the year indicated.
The unemployment rate was at 4.2% in August and the projections for Q4 2024 were revised up.
2 Projections for the unemployment rate are for the average civilian unemployment rate in the fourth quarter of the year indicated.
As of July 2024, PCE inflation increased 2.5 percent year-over-year (YoY). The projections for PCE inflation were revised down.
PCE core inflation increased 2.6 percent YoY in July. The projections for core PCE inflation were about the same.
The BEA's second estimate for Q2 GDP showed real growth at 3.0% annualized, following 1.4% annualized real growth in Q1. Early estimates for Q2 GDP are around 3% annualized, however, projections for Q4 2024 were revised down slightly!
| GDP projections of Federal Reserve Governors and Reserve Bank presidents, Change in Real GDP1 | ||||
|---|---|---|---|---|
| Projection Date | 2024 | 2025 | 2026 | 2027 |
| Sept 2024 | 1.9 to 2.1 | 1.8 to 2.2 | 1.9 to 2.3 | 1.8 to 2.1 |
| June 2024 | 1.9 to 2.3 | 1.8 to 2.2 | 1.8 to 2.1 | --- |
The unemployment rate was at 4.2% in August and the projections for Q4 2024 were revised up.
| Unemployment projections of Federal Reserve Governors and Reserve Bank presidents, Unemployment Rate2 | ||||
|---|---|---|---|---|
| Projection Date | 2024 | 2025 | 2026 | 2027 |
| Sept 2024 | 4.3 to 4.4 | 4.2 to 4.5 | 4.0 to 4.4 | 4.0 to 4.4 |
| June 2024 | 3.9 to 4.2 | 3.9 to 4.3 | 3.9 to 4.3 | --- |
As of July 2024, PCE inflation increased 2.5 percent year-over-year (YoY). The projections for PCE inflation were revised down.
| Inflation projections of Federal Reserve Governors and Reserve Bank presidents, PCE Inflation1 | ||||
|---|---|---|---|---|
| Projection Date | 2024 | 2025 | 2026 | 2027 |
| Sept 2024 | 2.2 to 2.4 | 2.1 to 2.2 | 2.0 | 2.0 |
| June 2024 | 2.5 to 2.9 | 2.2 to 2.4 | 2.0 to 2.1 | --- |
PCE core inflation increased 2.6 percent YoY in July. The projections for core PCE inflation were about the same.
| Core Inflation projections of Federal Reserve Governors and Reserve Bank presidents, Core Inflation1 | ||||
|---|---|---|---|---|
| Projection Date | 2024 | 2025 | 2026 | 2027 |
| Sept 2024 | 2.6 to 2.7 | 2.1 to 2.3 | 2.0 | 2.0 |
| June 2024 | 2.8 to 3.0 | 2.3 to 2.4 | 2.0 to 2.1 | --- |
FOMC Statement: 50bp Rate Cut
by Calculated Risk on 9/18/2024 02:00:00 PM
Fed Chair Powell press conference video here or on YouTube here, starting at 2:30 PM ET.
FOMC Statement:
Recent indicators suggest that economic activity has continued to expand at a solid pace. Job gains have slowed, and the unemployment rate has moved up but remains low. Inflation has made further progress toward the Committee's 2 percent objective but remains somewhat elevated.
The Committee seeks to achieve maximum employment and inflation at the rate of 2 percent over the longer run. The Committee has gained greater confidence that inflation is moving sustainably toward 2 percent, and judges that the risks to achieving its employment and inflation goals are roughly in balance. The economic outlook is uncertain, and the Committee is attentive to the risks to both sides of its dual mandate.
In light of the progress on inflation and the balance of risks, the Committee decided to lower the target range for the federal funds rate by 1/2 percentage point to 4-3/4 to 5 percent. In considering additional adjustments to the target range for the federal funds rate, the Committee will carefully assess incoming data, the evolving outlook, and the balance of risks. The Committee will continue reducing its holdings of Treasury securities and agency debt and agency mortgage‑backed securities. The Committee is strongly committed to supporting maximum employment and returning inflation to its 2 percent objective.
In assessing the appropriate stance of monetary policy, the Committee will continue to monitor the implications of incoming information for the economic outlook. The Committee would be prepared to adjust the stance of monetary policy as appropriate if risks emerge that could impede the attainment of the Committee's goals. The Committee's assessments will take into account a wide range of information, including readings on labor market conditions, inflation pressures and inflation expectations, and financial and international developments.
Voting for the monetary policy action were Jerome H. Powell, Chair; John C. Williams, Vice Chair; Thomas I. Barkin; Michael S. Barr; Raphael W. Bostic; Lisa D. Cook; Mary C. Daly; Beth M. Hammack; Philip N. Jefferson; Adriana D. Kugler; and Christopher J. Waller. Voting against this action was Michelle W. Bowman, who preferred to lower the target range for the federal funds rate by 1/4 percentage point at this meeting.
emphasis added
AIA: Architecture Billings Declined in August; Multi-family Billings Declined for 25th Consecutive Month
by Calculated Risk on 9/18/2024 11:51:00 AM
Note: This index is a leading indicator primarily for new Commercial Real Estate (CRE) investment.
From the AIA: Architecture firm billings remained sluggish in August, as the AIA/Deltek Architecture Billings Index (ABI) score declined to 45.7
It has now been nearly two years since firms saw sustained growth. However, clients are still expressing interest in new projects, as inquiries into work have continued to increase during that period. However, those inquiries remain challenging to convert to actual new projects in the pipeline, as the value of newly signed design contracts declined for the fifth consecutive month in August.• Northeast (48.2); Midwest (46.6); South (46.8); West (45.7)
Business conditions softened in all regions of the country in August, with firms located in the West reporting the softest conditions for the second consecutive month. Billings were flat at firms located in the Northeast for the previous two months but dipped back into negative territory again this month. Firms of all specializations also saw declining billings in August, with conditions remaining particularly soft at firms with a multifamily residential specialization.
...
The ABI score is a leading economic indicator of construction activity, providing an approximately nine-to-twelve-month glimpse into the future of nonresidential construction spending activity. The score is derived from a monthly survey of architecture firms that measures the change in the number of services provided to clients.
emphasis added
• Sector index breakdown: commercial/industrial (46.6); institutional (47.4); multifamily residential (44.0)
 Click on graph for larger image.
This graph shows the Architecture Billings Index since 1996. The index was at 45.7 in August, down from 48.2 in July. Anything below 50 indicates a decrease in demand for architects' services.
This index has indicated contraction for 22 of the last 23 months.
Note: This includes commercial and industrial facilities like hotels and office buildings, multi-family residential, as well as schools, hospitals and other institutions.
This index usually leads CRE investment by 9 to 12 months, so this index suggests a slowdown in CRE investment into 2025.
Note: This includes commercial and industrial facilities like hotels and office buildings, multi-family residential, as well as schools, hospitals and other institutions.
This index usually leads CRE investment by 9 to 12 months, so this index suggests a slowdown in CRE investment into 2025.
Note that multi-family billing turned down in August 2022 and has been negative for twenty-five consecutive months (with revisions). This suggests we will see a further weakness in multi-family starts.
Housing Starts Increased to 1.356 million Annual Rate in August
by Calculated Risk on 9/18/2024 09:27:00 AM
Today, in the Calculated Risk Real Estate Newsletter: Housing Starts Increased to 1.356 million Annual Rate in August
A brief excerpt:
Total housing starts in August were above expectations and starts in June and July were revised slightly. A solid report.There is much more in the article.
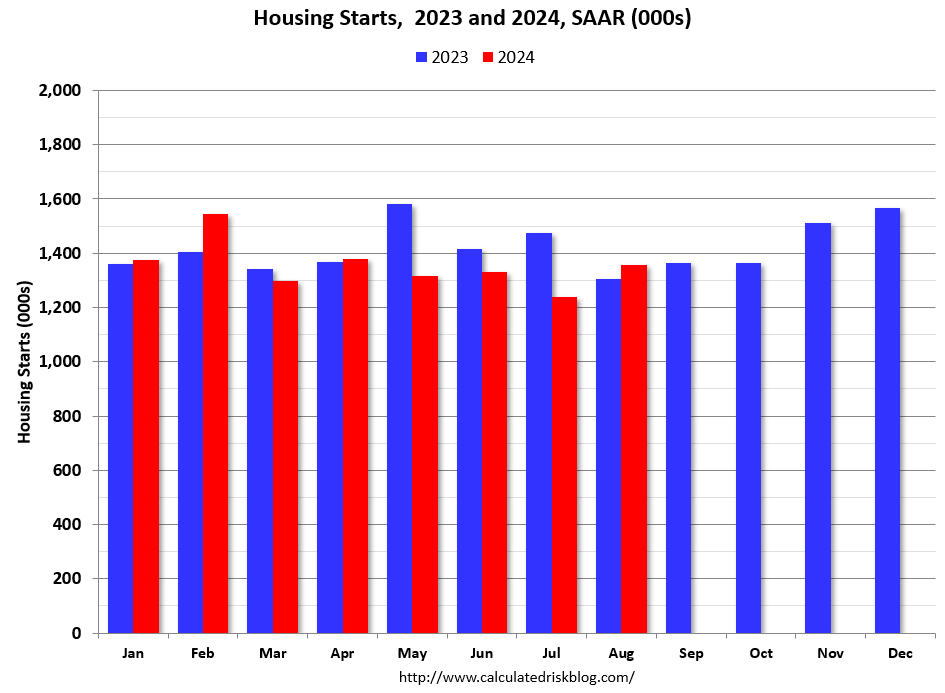
The third graph shows the month-to-month comparison for total starts between 2023 (blue) and 2024 (red).
Total starts were up 3.9% in August compared to August 2023.
The YoY increase in August total starts was due to an increase in both multi-family and single-family starts.
Single family starts have been up year-over-year in 12 of the last 14 months, whereas multi-family has been up year-over-year in only 2 of last 14 months. Year-to-date (YTD), total starts are down 4.0% compared to the same period in 2023. Single family starts are up 10.4% YTD, and multi-family down 32.6% YTD.
Housing Starts Increased to 1.356 million Annual Rate in August
by Calculated Risk on 9/18/2024 08:30:00 AM
From the Census Bureau: Permits, Starts and Completions
Housing Starts:
Privately-owned housing starts in August were at a seasonally adjusted annual rate of 1,356,000. This is 9.6 percent above the revised July estimate of 1,237,000 and is 3.9 percent above the August 2023 rate of 1,305,000. Single-family housing starts in August were at a rate of 992,000; this is 15.8 percent above the revised July figure of 857,000. The August rate for units in buildings with five units or more was 333,000.
Building Permits:
Privately-owned housing units authorized by building permits in August were at a seasonally adjusted annual rate of 1,475,000. This is 4.9 percent above the revised July rate of 1,406,000, but is 6.5 percent below the August 2023 rate of 1,578,000. Single-family authorizations in August were at a rate of 967,000; this is 2.8 percent above the revised July figure of 941,000. Authorizations of units in buildings with five units or more were at a rate of 451,000 in August.
emphasis added
 Click on graph for larger image.
The first graph shows single and multi-family housing starts since 2000.
Multi-family starts (blue, 2+ units) increased in August compared to July. Multi-family starts were up 5.5% year-over-year.
Single-family starts (red) increased in August and were up 5,1% year-over-year.
 The second graph shows single and multi-family housing starts since 1968.
 This shows the huge collapse following the housing bubble, and then the eventual recovery - and the recent collapse and recovery in single-family starts.
Total housing starts in August were above expectations and starts in June and July were revised slightly.
I'll have more later …
MBA: Mortgage Applications Increased in Weekly Survey
by Calculated Risk on 9/18/2024 07:00:00 AM
From the MBA: Mortgage Applications Increase in Latest MBA Weekly Survey
Mortgage applications increased 14.2 percent from one week earlier, according to data from the Mortgage Bankers Association’s (MBA) Weekly Applications Survey for the week ending September 13, 2024. Last week’s results included an adjustment for the Labor Day holiday.
The Market Composite Index, a measure of mortgage loan application volume, increased 14.2 percent on a seasonally adjusted basis from one week earlier. On an unadjusted basis, the Index increased 26 percent compared with the previous week. The Refinance Index increased 24 percent from the previous week and was 127 percent higher than the same week one year ago. The seasonally adjusted Purchase Index increased 5 percent from one week earlier. The unadjusted Purchase Index increased 15 percent compared with the previous week and was 0.4 percent lower than the same week one year ago.
“Application activity was up significantly last week, as market expectations of a rate cut from the Fed pulled mortgage rates lower. The 30-year fixed mortgage rate, at 6.15 percent, is now at its lowest since September 2022 and is more than a full percentage point lower than a year ago,” said Joel Kan, MBA’s Vice President and Deputy Chief Economist. “Refinance applications were up 24 percent – more than double last year’s pace, with both conventional and government activity jumping to the fastest pace of refinancing since 2022.”
Added Kan, “There was also an increase in purchase applications, and it is notable that conventional purchase applications increased to a pace ahead of last year, which also drove overall purchase applications very close to year-ago levels. Homebuyers are seeing improving affordability conditions, sparked by lower rates and slower home-price growth.”
...
The average contract interest rate for 30-year fixed-rate mortgages with conforming loan balances ($766,550 or less) decreased to 6.15 percent from 6.29 percent, with points increasing to 0.56 from 0.55 (including the origination fee) for 80 percent loan-to-value ratio (LTV) loans.
emphasis added
 Click on graph for larger image.
The first graph shows the MBA mortgage purchase index.
According to the MBA, purchase activity is down 0.4% year-over-year unadjusted (mostly unchanged year-over-year!).
Red is a four-week average (blue is weekly).
Purchase application activity is up about 17% from the lows in late October 2023, but still below the lowest levels during the housing bust.

The second graph shows the refinance index since 1990.
With higher mortgage rates, the refinance index declined sharply in 2022 - and mostly flat lined for two years - but has increased recently as mortgage rates declined.
Tuesday, September 17, 2024
Wednesday: Housing Starts, FOMC Announcement
by Calculated Risk on 9/17/2024 07:19:00 PM
 Note: Mortgage rates are from MortgageNewsDaily.com and are for top tier scenarios.
Wednesday:
• At 7:00 AM ET, The Mortgage Bankers Association (MBA) will release the results for the mortgage purchase applications index.
• At 8:30 AM, Housing Starts for August. The consensus is for 1.250 million SAAR, up from 1.238 million SAAR.
• During the day, The AIA's Architecture Billings Index for August (a leading indicator for commercial real estate).
• At 2:00 PM, FOMC Meeting Announcement. The Fed is expected to cut rates 25bp at this meeting.
• Also at 2:00 PM, FOMC Forecasts This will include the Federal Open Market Committee (FOMC) participants' projections of the appropriate target federal funds rate along with the quarterly economic projections.
• At 2:30 PM, Fed Chair Jerome Powell holds a press briefing following the FOMC announcement.
Lawler: Early Read on Existing Home Sales in August
by Calculated Risk on 9/17/2024 01:00:00 PM
Today, in the Calculated Risk Real Estate Newsletter: Lawler: Early Read on Existing Home Sales in August
A brief excerpt:
From housing economist Tom Lawler:There is more in the article.
Based on publicly-available local realtor/MLS reports released across the country through today, I project that existing home sales as estimated by the National Association of Realtors ran at a seasonally adjusted annual rate of 3.88 million in August, down 1.8% from July’s preliminary pace and down 3.7% from last August’s seasonally adjusted pace. Unadjusted sales should show a slightly larger YOY % decline, as there was one fewer business day this August compared to last August.
Local realtor/MLS reports suggest that the existing single-family home sales price last month was up 3.5% from last August.
CR Note: The National Association of Realtors (NAR) is scheduled to release August Existing Home Sales on Thursday, September 19th at 10 AM ET. The consensus is for 3.85 million SAAR, down from 3.95 million in July.


