 RSS Feed
 by Calculated Risk on 9/23/2024 06:59:00 PM
Monday, September 23, 2024
Tuesday: Case-Shiller House Prices, Richmond Fed Mfg
 From Matthew Graham at Mortgage News Daily: Mortgage Rates Move Slightly Higher to Start New Week
Mortgage rates rose modestly last week after hitting long term lows before the Fed announced its 0.50% rate cut. In not so many words, mortgage rates had already gotten in position for that cut and were thus left to undergo a mild correction. [30 year fixed 6.20%]Tuesday:
emphasis added
• At 9:00 AM ET, S&P/Case-Shiller House Price Index for July. The consensus is for a 5.9% year-over-year increase in the Composite 20 index for July.
• At 9:00 AM, FHFA House Price Index for July. This was originally a GSE only repeat sales, however there is also an expanded index.
• At 10:00 AM, the Richmond Fed manufacturing survey for September.
MBA Survey: Share of Mortgage Loans in Forbearance Increases to 0.31% in August
by Calculated Risk on 9/23/2024 04:10:00 PM
From the MBA: Share of Mortgage Loans in Forbearance Increases to 0.31% in August
The Mortgage Bankers Association’s (MBA) monthly Loan Monitoring Survey revealed that the total number of loans now in forbearance increased to 0.31% as of August 31, 2024. According to MBA’s estimate, 155,000 homeowners are in forbearance plans. Mortgage servicers have provided forbearance to approximately 8.2 million borrowers since March 2020.At the end of August, there were about 155,000 homeowners in forbearance plans.
The share of Fannie Mae and Freddie Mac loans in forbearance increased 1 basis point to 0.13% in August 2024. Ginnie Mae loans in forbearance increased by 10 basis points to 0.66%, and the forbearance share for portfolio loans and private-label securities (PLS) increased 2 basis points to 0.35%.
“For the third consecutive month, the percentage of loans in forbearance increased across all loan types,” said Marina Walsh, CMB, MBA’s Vice President of Industry Analysis. “By investor type, Ginnie Mae loans in forbearance have increased the most – up 27 basis points since May 2024.”
Added Walsh, “Forbearance levels are much lower than they were during the first two years of the pandemic. However, a weakening in the performance of servicing portfolios and an increase in forbearance requests are both likely given the softening observed in the labor market.”
emphasis added
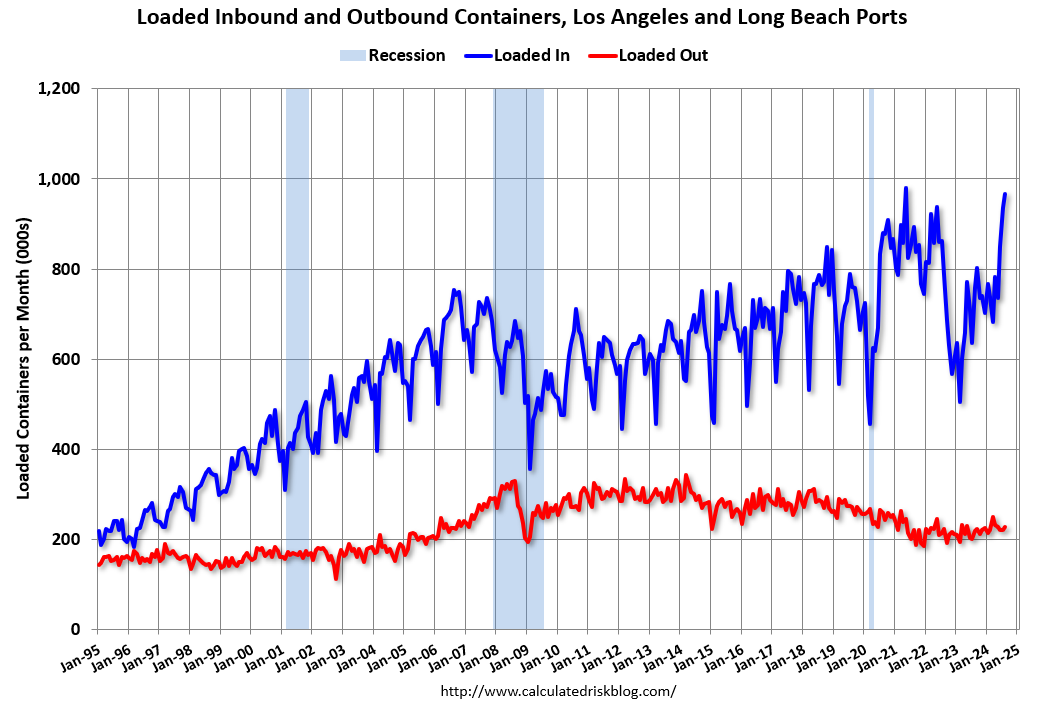
LA Ports: Inbound Traffic Increased Sharply Year-over-year in August
by Calculated Risk on 9/23/2024 02:05:00 PM
Container traffic gives us an idea about the volume of goods being exported and imported - and usually some hints about the trade report since LA area ports handle about 40% of the nation's container port traffic.
The following graphs are for inbound and outbound traffic at the ports of Los Angeles and Long Beach in TEUs (TEUs: 20-foot equivalent units or 20-foot-long cargo container).
To remove the strong seasonal component for inbound traffic, the first graph shows the rolling 12-month average.
 Click on graph for larger image.
On a rolling 12-month basis, inbound traffic increased 2.2% in August compared to the rolling 12 months ending in July. Outbound traffic increased 0.3% compared to the rolling 12 months ending the previous month.
The 2nd graph is the monthly data (with a strong seasonal pattern for imports).
 Usually imports peak in the July to October period as retailers import goods for the Christmas holiday, and then decline sharply and bottom in the Winter depending on the timing of the Chinese New Year.
 Usually imports peak in the July to October period as retailers import goods for the Christmas holiday, and then decline sharply and bottom in the Winter depending on the timing of the Chinese New Year.
 Imports were up 27% YoY in August, and exports were up 4% YoY.
In general, it appears port traffic is returning to the pre-pandemic patterns - although this was a very strong August for imports as retailers prepare for holiday shopping - and possibly to beat any increase in tariffs or the potential strike.
Watch Months-of-Supply!
by Calculated Risk on 9/23/2024 11:01:00 AM
Today, in the Calculated Risk Real Estate Newsletter: Watch Months-of-Supply!
A brief excerpt:
Both inventory and sales are well below pre-pandemic levels, and I think we need to keep an eye on months-of-supply to forecast price changes. Historically nominal prices declined when months-of-supply approached 6 months - and that is unlikely any time soon - however, as expected, months-of-supply is back to 2019 levels.There is much more in the article.
Months-of-supply was at 4.2 months in August compared to 4.0 months in August 2019. Even though inventory has declined significantly compared to 2019, sales have fallen even more - pushing up months-of-supply.
The following graph shows months-of-supply since 2017. Note that months-of-supply is higher than the last 3 years (2021 - 2023), and above August 2019. Months-of-supply was at 4.2 in August 2017 and 4.3 in August 2018. In 2020 (black), months-of-supply increased at the beginning of the pandemic and then declined sharply.
...
What would it take to get months-of-supply above 5 months? If sales stay depressed at 2023 and 2024 levels, how much would inventory have to increase to put months-of-supply at 5 months by, say, June 2024?

Housing Sept 23rd Weekly Update: Inventory up 1.6% Week-over-week, Up 37.2% Year-over-year
by Calculated Risk on 9/23/2024 08:11:00 AM
Altos reports that active single-family inventory was up 1.6% week-over-week. Inventory is now up 46.8% from the February seasonal bottom.
 Click on graph for larger image.
This inventory graph is courtesy of Altos Research.
As of September 20th, inventory was at 725 thousand (7-day average), compared to 714 thousand the prior week.
This is the highest level of inventory since May 2020.
The second graph shows the seasonal pattern for active single-family inventory since 2015.

The red line is for 2024. The black line is for 2019.
Inventory was up 37.2% compared to the same week in 2023 (last week it was up 37.4%), and down 24.0% compared to the same week in 2019 (last week it was down 25.2%).
Back in June 2023, inventory was down almost 54% compared to 2019, so the gap to more normal inventory levels is slowly closing.
Mike Simonsen discusses this data regularly on Youtube.
Sunday, September 22, 2024
Sunday Night Futures
by Calculated Risk on 9/22/2024 07:55:00 PM
Weekend:
• Schedule for Week of September 22, 2024
Monday:
• At 8:30 AM ET, Chicago Fed National Activity Index for August. This is a composite index of other data.
From CNBC: Pre-Market Data and Bloomberg futures S&P 500 and DOW futures are mostly unchanged (fair value).
Oil prices were up over the last week with WTI futures at $71.01 per barrel and Brent at $74.50 per barrel. A year ago, WTI was at $90, and Brent was at $94 - so WTI oil prices are down about 20% year-over-year.
Here is a graph from Gasbuddy.com for nationwide gasoline prices. Nationally prices are at $3.16 per gallon. A year ago, prices were at $3.84 per gallon, so gasoline prices are down $0.68 year-over-year.
The Top Ten Job Streaks: Current Streak is in 5th Place
by Calculated Risk on 9/22/2024 08:22:00 AM
For fun:
Through August 2024, the employment report indicated positive job growth for 44 consecutive months, putting the current streak in 5th place of the longest job streaks in US history (since 1939).
It appears this streak will survive the annual benchmark revision (that will revise down job growth).
Trivia: The only presidential term that saw job growth every month was President Obama's 2nd term.
Although job growth has slowed recently, we might see job growth every month during the current term.
| Headline Jobs, Top 10 Streaks | ||
|---|---|---|
| Year Ended | Streak, Months | |
| 1 | 2019 | 100 |
| 2 | 1990 | 48 |
| 3 | 2007 | 46 |
| 4 | 1979 | 45 |
| 5 | 20241 | 44 |
| 6 tie | 1943 | 33 |
| 6 tie | 1986 | 33 |
| 6 tie | 2000 | 33 |
| 9 | 1967 | 29 |
| 10 | 1995 | 25 |
| 1Currrent Streak | ||
Saturday, September 21, 2024
Real Estate Newsletter Articles this Week: Existing-Home Sales Decreased to 3.86 million SAAR in August
by Calculated Risk on 9/21/2024 02:11:00 PM
At the Calculated Risk Real Estate Newsletter this week:
 Click on graph for larger image.
• NAR: Existing-Home Sales Decreased to 3.86 million SAAR in August
• Housing Starts Increased to 1.356 million Annual Rate in August
• Part 2: Current State of the Housing Market; Overview for mid-September 2024
• Q2 Update: Delinquencies, Foreclosures and REO
• Lawler: Early Read on Existing Home Sales in August
This is usually published 4 to 6 times a week and provides more in-depth analysis of the housing market.
Schedule for Week of September 22, 2024
by Calculated Risk on 9/21/2024 08:11:00 AM
The key reports this week are August New Home sales, the third estimate of Q2 GDP, Personal Income and Outlays for August, and Case-Shiller house prices for July.
For manufacturing, the Richmond and Kansas City Fed manufacturing surveys will be released this week.
8:30 AM ET: Chicago Fed National Activity Index for August. This is a composite index of other data.
 9:00 AM: S&P/Case-Shiller House Price Index for July.
This graph shows the year-over-year change in the seasonally adjusted National Index, Composite 10 and Composite 20 indexes through the most recent report (the Composite 20 was started in January 2000).
The consensus is for a 5.9% year-over-year increase in the Composite 20 index for July.
9:00 AM: FHFA House Price Index for July. This was originally a GSE only repeat sales, however there is also an expanded index.
10:00 AM: the Richmond Fed manufacturing survey for September.
7:00 AM ET: The Mortgage Bankers Association (MBA) will release the results for the mortgage purchase applications index.
 10:00 AM: New Home Sales for August from the Census Bureau.
 This graph shows New Home Sales since 1963. The dashed line is the sales rate for last month.
The consensus is for 700 thousand SAAR, down from 739 thousand in July.
8:30 AM: The initial weekly unemployment claims report will be released. The consensus is for 226 thousand initial claims, up from 219 thousand last week.
8:30 AM: Gross Domestic Product, 2nd Quarter 2024 (Third Estimate), and Corporate Profits (Revised) The consensus is that real GDP increased 3.0% annualized in Q2, unchanged from the second estimate of 3.0%.
8:30 AM: Durable Goods Orders for August from the Census Bureau. The consensus is for a 2.8% decrease in durable goods orders.
9:20 AM: Speech, Fed Chair Jerome Powell, Opening Remarks (via pre-recorded video), At the 2024 U.S. Treasury Market Conference, Federal Reserve Bank of New York, New York, N.Y.
10:00 AM: Pending Home Sales Index for August. The consensus is 3.1% increase in the index.
11:00 AM: the Kansas City Fed manufacturing survey for September.
8:30 AM: Personal Income and Outlays, August 2024. The consensus is for a 0.4% increase in personal income, and for a 0.3% increase in personal spending. And for the Core PCE price index to increase 0.2%.
10:00 AM: University of Michigan's Consumer sentiment index (Final for September). The consensus is for a reading of 67.7.
Friday, September 20, 2024
September 20th COVID Update: Wastewater Measure Declining
by Calculated Risk on 9/20/2024 06:44:00 PM
 Note: Mortgage rates are from MortgageNewsDaily.com and are for top tier scenarios.
For deaths, I'm currently using 4 weeks ago for "now", since the most recent three weeks will be revised significantly.
Note: "Effective May 1, 2024, hospitals are no longer required to report COVID-19 hospital admissions, hospital capacity, or hospital occupancy data." So I'm no longer tracking hospitalizations.
| COVID Metrics | ||||
|---|---|---|---|---|
| Now | Week Ago | Goal | ||
| Deaths per Week🚩 | 1,139 | 1,022 | ≤3501 | |
| 1my goals to stop weekly posts, 🚩 Increasing number weekly for Deaths ✅ Goal met. | ||||
 Click on graph for larger image.
This graph shows the weekly (columns) number of deaths reported.
Although weekly deaths met the original goal to stop posting, I'm going to continue to post now that deaths are above the goal again.
Weekly deaths are more almost quadruple the low of 302 in early June.
 This appears to be a leading indicator for COVID hospitalizations and deaths.
COVID in wastewater is now declining.


