 RSS Feed
 by Calculated Risk on 9/30/2024 07:11:00 PM
Monday, September 30, 2024
Tuesday: Job Openings, ISM Mfg, Construction Spending, Vehicle Sales
 From Matthew Graham at Mortgage News Daily: Mortgage Rates Moderately Higher to Begin The Week
Mortgage rates have generally been moving higher since the Fed cut rates 2 weeks ago. ... While today's weakness can't be reduced to a single factor, the primary motivation was a speech from Fed Chair Powell in which he reminded the market that the Fed was not in a hurry to cut rates. The message wasn't that different from the press conference that followed the Fed rate cut 2 weeks ago, but some market participants were perhaps hoping to see a softer side of Powell. [30 year fixed 6.24%]Tuesday:
emphasis added
• At 10:00 AM ET, Job Openings and Labor Turnover Survey for August from the BLS.
• Also at 10:00 AM, ISM Manufacturing Index for September. The consensus is for a reading of 47.6, up from 47.2 in August.
• Also at 10:00 AM, Construction Spending for August. The consensus is for a 0.1% increase.
• All day, Light vehicle sales for September. The consensus is for sales of 15.7 million SAAR, up from 15.1 million SAAR in August (Seasonally Adjusted Annual Rate).
Freddie Mac House Price Index Increased Slightly in August; Up 3.7% Year-over-year
by Calculated Risk on 9/30/2024 02:17:00 PM
Today, in the Calculated Risk Real Estate Newsletter: Freddie Mac House Price Index Increased Slightly in August; Up 3.7% Year-over-year
A brief excerpt:
Freddie Mac reported that its “National” Home Price Index (FMHPI) increased 0.11% month-over-month on a seasonally adjusted (SA) basis in August. On a year-over-year basis, the National FMHPI was up 3.7% in August, down from up 4.5% YoY in July. The YoY increase peaked at 19.1% in July 2021, and for this cycle, bottomed at up 0.9% YoY in May 2023. ...
Over the last 6 months, the seasonal adjusted index has increased at a 1.5% annual rate
...As of August, 15 states and D.C. were below their previous peaks, Seasonally Adjusted. The largest seasonally adjusted declines from the recent peak were in Louisiana (-2.5%), Arkansas (-2.1%), D.C. (-2.0), Florida (-1.9%), Texas (-1.5%), and Idaho (-1.1%).
For cities (Core-based Statistical Areas, CBSA), here are the 30 cities with the largest declines from the peak, seasonally adjusted. Austin continues to be the worst performing city. However, 11 of the 30 worst performing cities are now in Florida!

There is much more in the article.
Fed Chair Powell: Economic Outlook
by Calculated Risk on 9/30/2024 01:56:00 PM
From Fed Chair Powell: Economic Outlook (Watch here on YouTube). Excerpt:
Our economy is strong overall and has made significant progress over the past two years toward achieving our dual-mandate goals of maximum employment and stable prices. Labor market conditions are solid, having cooled from their previously overheated state. Inflation has eased, and my Federal Open Market Committee colleagues and I have greater confidence that it is on a sustainable path to 2 percent. At our meeting earlier this month, we reduced the level of policy restraint by lowering the target range of the federal funds rate by 1/2 percentage point. That decision reflects our growing confidence that, with an appropriate recalibration of our policy stance, strength in the labor market can be maintained in an environment of moderate economic growth and inflation moving sustainably down to our objective.
Final Look at Local Housing Markets in August and a Look Ahead to September Sales
by Calculated Risk on 9/30/2024 10:31:00 AM
Today, in the Calculated Risk Real Estate Newsletter: Final Look at Local Housing Markets in August and a Look Ahead to September Sales
A brief excerpt:
After the National Association of Realtors® (NAR) releases the monthly existing home sales report, I pick up additional local market data that is reported after the NAR. This is the final look at local markets in August.There is much more in the article.
The big story for August was that existing home sales decreased to 3.86 million on a seasonally adjusted annual rate basis (SAAR) - just above the cycle low of 3.85 million SAAR in October 2023 - and the 36th consecutive month with a year-over-year decline.
...
In August, sales in these markets were down 4.5% YoY. The NAR reported sales were down 5.7% year-over-year NSA in August.
Sales in all of these markets are down compared to August 2019.
This was a year-over-year decrease NSA for these markets. However, there was one fewer working day in August 2024 compared to August 2023 (22 vs 23), so seasonally adjusted sales were down less than NSA sales.
September sales will be mostly for contracts signed in July and August, and mortgage rates decreased to an average of 6.50% in August, down from 6.85% in July. My early expectation is we will see existing home sales up year-over-year in September - for the first time in over 3 years!

Housing Sept 30th Weekly Update: Inventory up 0.8% Week-over-week, Up 36.7% Year-over-year
by Calculated Risk on 9/30/2024 08:11:00 AM
Altos reports that active single-family inventory was up 0.8% week-over-week. Inventory is now up 48.0% from the February seasonal bottom.
 Click on graph for larger image.
This inventory graph is courtesy of Altos Research.
As of September 27th, inventory was at 731 thousand (7-day average), compared to 725 thousand the prior week.
This is the highest level of inventory since May 2020.
The second graph shows the seasonal pattern for active single-family inventory since 2015.

The red line is for 2024. The black line is for 2019.
Inventory was up 36.7% compared to the same week in 2023 (last week it was up 37.2%), and down 23.4% compared to the same week in 2019 (last week it was down 24.0%).
Back in June 2023, inventory was down almost 54% compared to 2019, so the gap to more normal inventory levels is slowly closing.
Mike Simonsen discusses this data regularly on Youtube.
Sunday, September 29, 2024
Sunday Night Futures
by Calculated Risk on 9/29/2024 07:08:00 PM
Weekend:
• Schedule for Week of September 29, 2024
Monday:
• At 9:45 AM ET, Chicago Purchasing Managers Index for September. The consensus is for a reading of 46.5, up from 46.1 in August.
• At 10:30 AM, Dallas Fed Survey of Manufacturing Activity for September.
• At 1:55 PM, Speech, Fed Chair Jerome Powell, Economic Outlook, At the National Association for Business Economics (NABE) Annual Meeting, Nashville, Tenn
From CNBC: Pre-Market Data and Bloomberg futures S&P 500 and DOW futures are mostly unchanged (fair value).
Oil prices were down over the last week with WTI futures at $68.01 per barrel and Brent at $71.86 per barrel. A year ago, WTI was at $91, and Brent was at $96 - so WTI oil prices are down about 25% year-over-year.
Here is a graph from Gasbuddy.com for nationwide gasoline prices. Nationally prices are at $3.18 per gallon. A year ago, prices were at $3.82 per gallon, so gasoline prices are down $0.64 year-over-year.
Realtor.com Reports Active Inventory Up 33.2% YoY
by Calculated Risk on 9/29/2024 01:23:00 PM
What this means: On a weekly basis, Realtor.com reports the year-over-year change in active inventory and new listings. On a monthly basis, they report total inventory. For August, Realtor.com reported inventory was up 5.8% YoY, but still down 26.4% compared to the 2017 to 2019 same month levels.
Now - on a weekly basis - inventory is up 33.2% YoY.
Realtor.com has monthly and weekly data on the existing home market. Here is their weekly report: Weekly Housing Trends View—Data for Week Ending Sept. 21, 2024 Here is a graph of the year-over-year change in inventory according to realtor.com.
Inventory was up year-over-year for the 46th consecutive week.
Realtor.com has monthly and weekly data on the existing home market. Here is their weekly report: Weekly Housing Trends View—Data for Week Ending Sept. 21, 2024
• Active inventory increased, with for-sale homes 33.2% above year-ago levels.
For the 46th consecutive week dating back to November 2023, the number of listings for sale has grown year-over-year, and this week continues a string of growth rates in the mid-30% range that started in April. There were more homes for sale this week than in any week since January 2020, pre-pandemic. Much of the inventory build up is due to more seller activity than buyer activity, but falling mortgage rates could mean more buyers enter the market in the coming weeks.
• New listings–a measure of sellers putting homes up for sale- jumped 8.0% this week compared to one year ago.
As the recent easing of mortgage rates kept encouraging many sellers to return to the market, the year-over-year growth in new listings continued this week. With mortgage rates at their lowest level in nearly two years, eager sellers are taking the chance to get their home listed, hoping to catch some of the fall buyer activity. This trend is expected to continue as rates ease further and more sellers are ‘unlocked’.
 Here is a graph of the year-over-year change in inventory according to realtor.com.
 Inventory was up year-over-year for the 46th consecutive week.
However, inventory is still historically low.
New listings remain below typical pre-pandemic levels.
Saturday, September 28, 2024
Real Estate Newsletter Articles this Week: Case-Shiller National HPI Up 5.0% year-over-year in July
by Calculated Risk on 9/28/2024 02:11:00 PM
At the Calculated Risk Real Estate Newsletter this week:
 Click on graph for larger image.
• Case-Shiller: National House Price Index Up 5.0% year-over-year in July
• New Home Sales Decrease to 716,000 Annual Rate in August
• Inflation Adjusted House Prices 1.5% Below 2022 Peak
• Fannie and Freddie: Single Family Serious Delinquency Rate Ticked Up in August
• Watch Months-of-Supply!
This is usually published 4 to 6 times a week and provides more in-depth analysis of the housing market.
Schedule for Week of September 29, 2024
by Calculated Risk on 9/28/2024 08:11:00 AM
The key report scheduled for this week is the September employment report on Friday.
Other key indicators include the September ISM Manufacturing and Services indices and September auto sales.
10:30 AM: Dallas Fed Survey of Manufacturing Activity for September.
9:45 AM: Chicago Purchasing Managers Index for September. The consensus is for a reading of 46.5, up from 46.1 in August.
1:55 PM: Speech, Fed Chair Jerome Powell, Economic Outlook, At the National Association for Business Economics (NABE) Annual Meeting, Nashville, Tenn
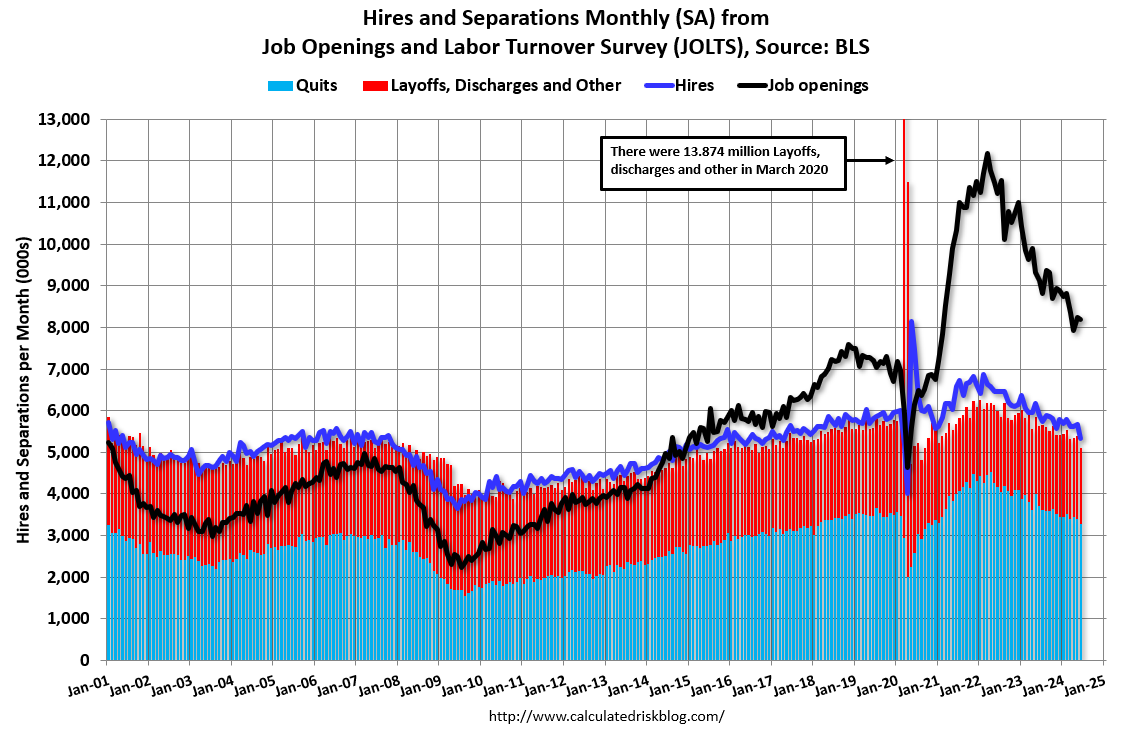 10:00 AM: Job Openings and Labor Turnover Survey for August from the BLS.
 This graph shows job openings (black line), hires (purple), Layoff, Discharges and other (red column), and Quits (light blue column) from the JOLTS.
10:00 AM: ISM Manufacturing Index for September. The consensus is for a reading of 47.6, up from 47.2 in August.
10:00 AM: Construction Spending for August. The consensus is for a 0.1% increase.
 All day: Light vehicle sales for September.
The consensus is for sales of 15.7 million SAAR, up from 15.1 million SAAR in August (Seasonally Adjusted Annual Rate).
This graph shows light vehicle sales since the BEA started keeping data in 1967. The dashed line is the current sales rate.
7:00 AM ET: The Mortgage Bankers Association (MBA) will release the results for the mortgage purchase applications index.
8:15 AM: The ADP Employment Report for September. This report is for private payrolls only (no government). The consensus is for 110,000 jobs added, up from 99,000 in August.
8:30 AM: The initial weekly unemployment claims report will be released. The consensus is for 224 thousand initial claims, up from 218 thousand last week.
10:00 AM: the ISM Services Index for September.
 8:30 AM: Employment Report for September. The consensus is for 145,000 jobs added, and for the unemployment rate to be unchanged at 4.2%.
There were 142,000 jobs added in August, and the unemployment rate was at 4.2%.
This graph shows the jobs added per month since January 2021.
Friday, September 27, 2024
September 27th COVID Update: Wastewater Measure Declining
by Calculated Risk on 9/27/2024 07:20:00 PM
 Note: Mortgage rates are from MortgageNewsDaily.com and are for top tier scenarios.
For deaths, I'm currently using 4 weeks ago for "now", since the most recent three weeks will be revised significantly.
Note: "Effective May 1, 2024, hospitals are no longer required to report COVID-19 hospital admissions, hospital capacity, or hospital occupancy data." So I'm no longer tracking hospitalizations.
| COVID Metrics | ||||
|---|---|---|---|---|
| Now | Week Ago | Goal | ||
| Deaths per Week🚩 | 1,239 | 1,176 | ≤3501 | |
| 1my goals to stop weekly posts, 🚩 Increasing number weekly for Deaths ✅ Goal met. | ||||
 Click on graph for larger image.
This graph shows the weekly (columns) number of deaths reported.
Although weekly deaths met the original goal to stop posting, I'm going to continue to post now that deaths are above the goal again.
Weekly deaths are quadruple the low of 302 in early June.
 This appears to be a leading indicator for COVID hospitalizations and deaths.
COVID in wastewater is now declining suggesting weekly deaths will start declining soon.


