 RSS Feed
 by Calculated Risk on 10/04/2024 03:41:00 PM
Friday, October 04, 2024
Q3 GDP Tracking: Around 3%
From BofA:
Since our last weekly publication, our 3Q GDP tracking estimate is up three-tenths to 2.6% q/q saar. [Oct 4th estimate]From Goldman:
emphasis added
We left our Q3 GDP tracking estimate unchanged at +3.2% (quarter-over-quarter annualized) and our domestic final sales estimate unchanged at +2.8%. [Oct 3rd estimate]And from the Atlanta Fed: GDPNow
The GDPNow model estimate for real GDP growth (seasonally adjusted annual rate) in the third quarter of 2024 is 2.5 percent on October 1, down from 3.1 percent on September 27. [Oct 1st estimate]
Asking Rents Mostly Unchanged Year-over-year
by Calculated Risk on 10/04/2024 12:37:00 PM
Today, in the Real Estate Newsletter: Asking Rents Mostly Unchanged Year-over-year
Brief excerpt:
Tracking rents is important for understanding the dynamics of the housing market. For example, the sharp increase in rents helped me deduce that there was a surge in household formation in 2021 (See from September 2021: Household Formation Drives Housing Demand)....
Slower household formation and increased supply (more multi-family completions) has kept asking rents under pressure. ...
Welcome to the October 2024 Apartment List National Rent Report. The national median rent dipped by 0.5% in September, as we turn the corner into the slow season for the rental market. The median rent nationally now stands at $1,405, and we’re likely to see that number continue to dip modestly through the remainder of the year.

Realtor.com: 13th Consecutive Month with Year-over-year Decline in Rents
In August 2024, the U.S. median rent continued to decline year over year for the 13th month in a row, down $5, or -0.3%, year over year for 0-2 bedroom properties across the top 50 metros
Comments on September Employment Report
by Calculated Risk on 10/04/2024 09:16:00 AM
The headline jobs number in the September employment report was well above expectations, and July and August payrolls were revised up by 72,000 combined. The participation rate was unchanged, the employment population ratio increased, and the unemployment rate decreased to 4.1%.
Construction employment increased 25 thousand and is now 688 thousand above the pre-pandemic level.
Manufacturing employment decreased 7 thousand and is now 137 thousand above the pre-pandemic level.
Prime (25 to 54 Years Old) Participation
 Since the overall participation rate is impacted by both cyclical (recession) and demographic (aging population, younger people staying in school) reasons, here is the employment-population ratio for the key working age group: 25 to 54 years old.
The 25 to 54 years old participation decreased in September to 83.8% from 83.9% in August.
The 25 to 54 employment population ratio was unchanged at 80.9% from 80.9% the previous month.
Both are above pre-pandemic levels and near the highest level this millennium.
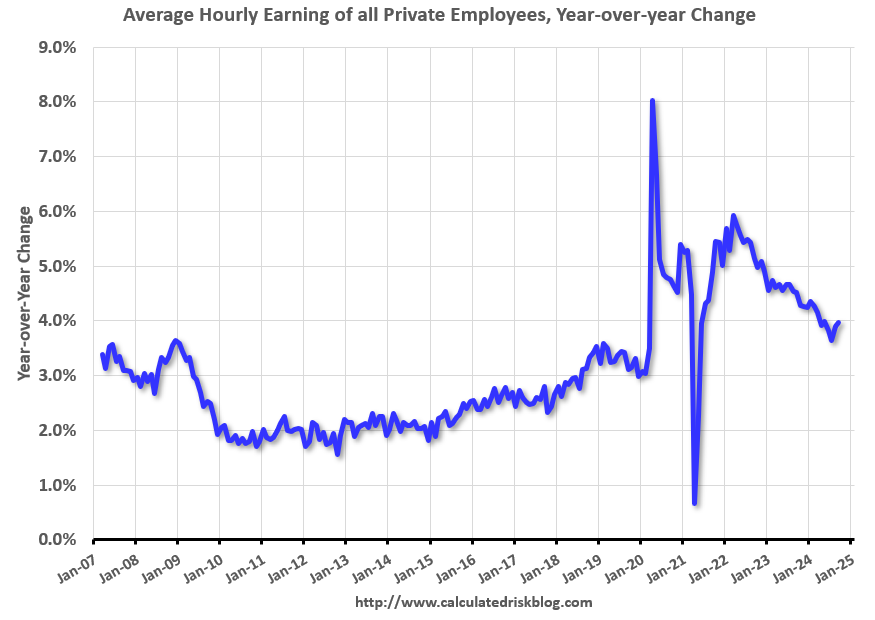
Average Hourly Wages
 The graph shows the nominal year-over-year change in "Average Hourly Earnings" for all private employees from the Current Employment Statistics (CES).
Average Hourly Wages
 The graph shows the nominal year-over-year change in "Average Hourly Earnings" for all private employees from the Current Employment Statistics (CES).
 There was a huge increase at the beginning of the pandemic as lower paid employees were let go, and then the pandemic related spike reversed a year later.
Wage growth has trended down after peaking at 5.9% YoY in March 2022 and was at 4.0% YoY in September.
Wage growth has trended down after peaking at 5.9% YoY in March 2022 and was at 4.0% YoY in September.
Part Time for Economic Reasons
 From the BLS report:
"The number of people employed part time for economic reasons changed little at 4.6 million in September. This measure is up from 4.1 million a year earlier. These individuals would have preferred full-time employment but were working part time because their hours had been reduced or they were unable to find full-time jobs."The number of persons working part time for economic reasons decreased in September to 4.62 million from 4.83 million in August. This is above the pre-pandemic levels.
These workers are included in the alternate measure of labor underutilization (U-6) that decreased to 7.7% from 7.9% in the previous month. This is down from the record high in April 2020 of 23.0% and up from the lowest level on record (seasonally adjusted) in December 2022 (6.5%). (This series started in 1994). This measure is above the 7.0% level in February 2020 (pre-pandemic).
Unemployed over 26 Weeks
 This graph shows the number of workers unemployed for 27 weeks or more.
 According to the BLS, there are 1.63 million workers who have been unemployed for more than 26 weeks and still want a job, up from 1.53 million the previous month.
This is down from post-pandemic high of 4.174 million, and up from the recent low of 1.050 million.
This is above pre-pandemic levels.
Job Streak
Summary:
The headline jobs number in the September employment report was well above expectations, and July and August payrolls were revised up by 72,000 combined. The participation rate was unchanged, the employment population ratio increased, and the unemployment rate decreased to 4.1%.
This is above pre-pandemic levels.
Job Streak
Through September 2024, the employment report indicated positive job growth for 45 consecutive months, putting the current streak tied in 4th place of the longest job streaks in US history (since 1939). It appears this streak will survive the annual benchmark revision (that will revise down job growth).
| Headline Jobs, Top 10 Streaks | ||
|---|---|---|
| Year Ended | Streak, Months | |
| 1 | 2019 | 100 |
| 2 | 1990 | 48 |
| 3 | 2007 | 46 |
| 4 tie | 1979 | 45 |
| 4 tie | 20241 | 45 |
| 6 tie | 1943 | 33 |
| 6 tie | 1986 | 33 |
| 6 tie | 2000 | 33 |
| 9 | 1967 | 29 |
| 10 | 1995 | 25 |
| 1Currrent Streak | ||
Summary:
The headline jobs number in the September employment report was well above expectations, and July and August payrolls were revised up by 72,000 combined. The participation rate was unchanged, the employment population ratio increased, and the unemployment rate decreased to 4.1%.
This was a strong employment report.
September Employment Report: 254 thousand Jobs, 4.1% Unemployment Rate
by Calculated Risk on 10/04/2024 08:30:00 AM
From the BLS: Employment Situation
Total nonfarm payroll employment increased by 254,000 in September, and the unemployment rate changed little at 4.1 percent, the U.S. Bureau of Labor Statistics reported today. Employment continued to trend up in food services and drinking places, health care, government, social assistance, and construction.
...
The change in total nonfarm payroll employment for July was revised up by 55,000, from +89,000 to +144,000, and the change for August was revised up by 17,000, from +142,000 to +159,000. With these revisions, employment in July and August combined is 72,000 higher than previously reported.
emphasis added
 Click on graph for larger image.
The first graph shows the jobs added per month since January 2021.
Total payrolls increased by 254 thousand in September. Private payrolls increased by 223 thousand, and public payrolls increased 32 thousand.
Payrolls for July and August were revised up 72 thousand, combined.
Payrolls for July and August were revised up 72 thousand, combined.
 The second graph shows the year-over-year change in total non-farm employment since 1968.
In September, the year-over-year change was 2.44 million jobs. Employment was up solidly year-over-year (Although the annual benchmark revision will lower the year-over-year change).
The third graph shows the employment population ratio and the participation rate.
 The Labor Force Participation Rate was unchanged at 62.7% in September, from 62.7% in August. This is the percentage of the working age population in the labor force.
 The Employment-Population ratio increased to 60.2% from 60.0% in August (blue line).
I'll post the 25 to 54 age group employment-population ratio graph later.
 The fourth graph shows the unemployment rate.
 The unemployment rate decreased to 4.1% in September from 4.2% in August.
This was well above consensus expectations, and July and August payrolls were revised up by 72,000 jobs, combined.
A strong report. I'll have more later ...
Thursday, October 03, 2024
Friday: Employment Report
by Calculated Risk on 10/03/2024 07:33:00 PM
 Note: Mortgage rates are from MortgageNewsDaily.com and are for top tier scenarios.
Friday:
• At 8:30 AM ET, 8:30 AM: Employment Report for September. The consensus is for 145,000 jobs added, and for the unemployment rate to be unchanged at 4.2%.
September Employment Preview
by Calculated Risk on 10/03/2024 03:27:00 PM
On Friday at 8:30 AM ET, the BLS will release the employment report for September. The consensus is for 145,000 jobs added, and for the unemployment rate to be unchanged at 4.2%.
There were 142,000 jobs added in August, and the unemployment rate was at 4.2%.
From BofA:
Although the labor market has been soft, low jobless claims suggest that the September employment report should be decent. We forecast a 150k increase in nonfarm payrolls, compared to 142k in August ... We look for the unemployment rate to remain unchanged at 4.2%From Goldman Sachs:
emphasis added
We estimate nonfarm payrolls rose by 165k in September, above consensus of +150k ... We estimate that the unemployment rate was unchanged on a rounded basis at 4.2%, in line with consensus.• ADP Report: The ADP employment report showed 143,000 private sector jobs were added in September. This was above consensus forecasts and suggests job gains above consensus expectations, however, in general, ADP hasn't been very useful in forecasting the BLS report.
• ISM Surveys: Note that the ISM indexes are diffusion indexes based on the number of firms hiring (not the number of hires). The ISM® manufacturing employment index decreased to 43.9%, down from 46.0% the previous month. This would suggest about 50,000 jobs lost in manufacturing. The ADP report indicated 2,000 manufacturing jobs added in September.
The ISM® services employment index decreased to 48.1%, from 50.1%. This would suggest 20,000 jobs added in the service sector. Combined this suggests 30,000 jobs lost in September, far below consensus expectations. (Note: The ISM surveys have been way off recently)
• Unemployment Claims: The weekly claims report showed fewer initial unemployment claims during the reference week at 222,000 in September compared to 233,000 in August. This suggests fewer layoffs in September compared to August.
• Conclusion: My guess is employment gains will be below consensus expectations.
Realtor.com Reports Active Inventory Up 31.9% YoY
by Calculated Risk on 10/03/2024 02:42:00 PM
What this means: On a weekly basis, Realtor.com reports the year-over-year change in active inventory and new listings. On a monthly basis, they report total inventory. For September, Realtor.com reported inventory was up 34.0% YoY, but still down 23.2% compared to the 2017 to 2019 same month levels.
Now - on a weekly basis - inventory is up 31.9% YoY.
Realtor.com has monthly and weekly data on the existing home market. Here is their weekly report: Weekly Housing Trends View—Data for Week Ending Sept. 28, 2024 Here is a graph of the year-over-year change in inventory according to realtor.com.
Inventory was up year-over-year for the 46th consecutive week.
Realtor.com has monthly and weekly data on the existing home market. Here is their weekly report: Weekly Housing Trends View—Data for Week Ending Sept. 28, 2024
• Active inventory increased, with for-sale homes 31.9% above year-ago levels
For the 47th consecutive week dating to November 2023, the number of listings for sale has grown year over year, and this week continues a string of growth rates in the mid-30% range that started in April. There were more homes for sale this week than in any week since January 2020, pre-pandemic. Much of the inventory buildup is due to more seller activity than buyer activity, but falling mortgage rates could mean more buyers enter the market in the coming weeks.
• New listings—a measure of sellers putting homes up for sale—jumped 1.7% this week compared with a year ago
The number of new listings has continued to increase, though at a slower pace. This slowdown isn’t entirely surprising, as a rate cut has been widely anticipated, eager sellers may have already acted by listing their homes in the weeks leading up to the Fed’s announcement. Looking ahead, with another rate cut expected before the end of 2024, we anticipate that more sellers will feel “unlocked,” as the prevailing mortgage rates come into closer alignment with their current rates.
 Here is a graph of the year-over-year change in inventory according to realtor.com.
 Inventory was up year-over-year for the 46th consecutive week.
However, inventory is still historically low.
New listings remain below typical pre-pandemic levels.
Moody's: Apartment Vacancy Rate Unchanged in Q3; Office Vacancy Rate at Record High
by Calculated Risk on 10/03/2024 11:44:00 AM
Today, in the Calculated Risk Real Estate Newsletter: Moody's: Apartment Vacancy Rate Unchanged in Q3; Office Vacancy Rate at Record High
A brief excerpt:
From Moody’s Analytics Economists: Multifamily Performance Steadied, Office Stress Continued to Manifest, Retail Vacancy Declined, And Industrial Cooled DownThere is much more in the article.National multifamily vacancy stayed flat at 5.8%, the highest level on record since 2011. Supply side pressure was the main driver for the creep-up of vacancy since late 2022.Moody’s Analytics (Reis) reported that the apartment vacancy rate was at 5.8% in Q3 2024, unchanged from an upwardly revised 5.8% in Q2, and up from the pandemic peak of 5.6% in Q1 2021. This is the highest vacancy rate since 2011. Note that asking rents are down slightly year-over-year.
This graph shows the apartment vacancy rate starting in 1980. (Annual rate before 1999, quarterly starting in 1999). Note: Moody’s Analytics is just for large cities.

ISM® Services Index Increases to 54.9% in September
by Calculated Risk on 10/03/2024 10:00:00 AM
(Posted with permission). The ISM® Services index was at 54.9%, up from 51.5% last month. The employment index decreased to 48.1%, from 50.1%. Note: Above 50 indicates expansion, below 50 in contraction.
From the Institute for Supply Management: Services PMI® at 54.9% September 2024 2024 Services ISM® Report On Business®
Economic activity in the services sector expanded for the third consecutive month in September, say the nation's purchasing and supply executives in the latest Services ISM® Report On Business®. The Services PMI® registered 54.9 percent, which is the highest reading since February 2023 and indicates sector expansion for the 49th time in 52 months.The PMI was well above expectations.
The report was issued today by Steve Miller, CPSM, CSCP, Chair of the Institute for Supply Management® (ISM®) Services Business Survey Committee: “In September, the Services PMI® registered 54.9 percent, 3.4 percentage points higher than August’s figure of 51.5 percent. The reading in September marked the seventh time the composite index has been in expansion territory this year. The Business Activity Index registered 59.9 percent in September, 6.6 percentage points higher than the 53.3 percent recorded in August, indicating a third month of expansion after a contraction in June. The New Orders Index expanded to 59.4 percent in September, 6.4 percentage points higher than August’s figure of 53 percent. The Employment Index contracted for the first time in three months; the reading of 48.1 percent is a 2.1-percentage point decrease compared to the 50.2 percent recorded in August.
emphasis added
Weekly Initial Unemployment Claims Increase to 225,000
by Calculated Risk on 10/03/2024 08:30:00 AM
The DOL reported:
In the week ending September 28, the advance figure for seasonally adjusted initial claims was 225,000, an increase of 6,000 from the previous week's revised level. The previous week's level was revised up by 1,000 from 218,000 to 219,000. The 4-week moving average was 224,250, a decrease of 750 from the previous week's revised average. The previous week's average was revised up by 250 from 224,750 to 225,000.The following graph shows the 4-week moving average of weekly claims since 1971.
emphasis added
 Click on graph for larger image.
The dashed line on the graph is the current 4-week average. The four-week average of weekly unemployment claims decreased to 224,250.
The previous week was revised up.
Weekly claims were above the consensus forecast.


