 RSS Feed
 by Calculated Risk on 1/12/2025 06:45:00 PM
Sunday, January 12, 2025
Sunday Night Futures
Weekend:
• Schedule for Week of January 12, 2025
Monday:
• No major economic releases scheduled.
From CNBC: Pre-Market Data and Bloomberg futures S&P 500 are unchanged and DOW futures are up 68 (fair value).
Oil prices were up over the last week with WTI futures at $76.57 per barrel and Brent at $79.76 per barrel. A year ago, WTI was at $73, and Brent was at $80 - so WTI oil prices are up about 5% year-over-year.
Here is a graph from Gasbuddy.com for nationwide gasoline prices. Nationally prices are at $3.06 per gallon. A year ago, prices were at $3.06 per gallon, so gasoline prices are unchanged year-over-year.
January 12th COVID Update: COVID in Wastewater Increasing
by Calculated Risk on 1/12/2025 10:17:00 AM
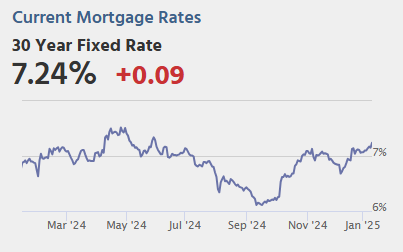 Note: Mortgage rates are from MortgageNewsDaily.com and are for top tier scenarios.
For deaths, I'm currently using 4 weeks ago for "now", since the most recent three weeks will be revised significantly.
Note: "Effective May 1, 2024, hospitals are no longer required to report COVID-19 hospital admissions, hospital capacity, or hospital occupancy data." So I'm no longer tracking hospitalizations.
| COVID Metrics | ||||
|---|---|---|---|---|
| Now | Week Ago | Goal | ||
| Deaths per Week🚩 | 500 | 450 | ≤3501 | |
| 1my goals to stop weekly posts. 🚩 Increasing number weekly for Deaths. ✅ Goal met. | ||||
 Click on graph for larger image.
This graph shows the weekly (columns) number of deaths reported for the last 2 years.
Although weekly deaths met the original goal to stop posting, I'm continuing to post now that deaths are above the goal again - and at a minimum, I'll continue to post through the Winter.
Weekly deaths have mostly been declining, however weekly deaths are still above the low of 313 in early June 2024.
 This appears to be a leading indicator for COVID hospitalizations and deaths.
Natinally COVID in wastewater is "HIGH" according to the CDC - especially in the Midwest where it is "Very High" - and more than triple the lows of last May - and increasing. Something to watch.
Saturday, January 11, 2025
Real Estate Newsletter Articles this Week: Apartment Vacancy Rate Increased in Q4
by Calculated Risk on 1/11/2025 02:11:00 PM
At the Calculated Risk Real Estate Newsletter this week:
 Click on graph for larger image.
• Moody's: Apartment Vacancy Rate Increased in Q4; Office Vacancy Rate at Record High
• 1st Look at Local Housing Markets in December
• Asking Rents Mostly Unchanged Year-over-year
• Update: The Housing Bubble and Mortgage Debt as a Percent of GDP
This is usually published 4 to 6 times a week and provides more in-depth analysis of the housing market.
Schedule for Week of January 12, 2025
by Calculated Risk on 1/11/2025 08:11:00 AM
The key reports this week are December CPI, retail sales, and housing starts.
For manufacturing, the December Industrial Production report and the January New York and Philly Fed manufacturing surveys will be released.
No major economic releases scheduled.
6:00 AM: NFIB Small Business Optimism Index for December.
8:30 AM ET: The Producer Price Index for December from the BLS. The consensus is for a 0.4% increase in PPI, and a 0.3% increase in core PPI.
7:00 AM ET: The Mortgage Bankers Association (MBA) will release the mortgage purchase applications index.
8:30 AM: The Consumer Price Index for December from the BLS. The consensus is for 0.3% increase in CPI, and a 0.2% increase in core CPI. The consensus is for CPI to be up 2.9% year-over-year and core CPI to be up 3.3% YoY.
8:30 AM: The New York Fed Empire State manufacturing survey for January. The consensus is for a reading of -2.0, down from 0.2.
2:00 PM: the Federal Reserve Beige Book, an informal review by the Federal Reserve Banks of current economic conditions in their Districts.
8:30 AM: The initial weekly unemployment claims report will be released. The consensus is for a increase to 215 thousand from 201 thousand last week.
 8:30 AM: Retail sales for December is scheduled to be released. The consensus is for a 0.5% increase in retail sales.
This graph shows retail sales since 1992. This is monthly retail sales and food service, seasonally adjusted (total and ex-gasoline).
8:30 AM: the Philly Fed manufacturing survey for January.
10:00 AM: The January NAHB homebuilder survey.
The consensus is for a reading of 45, down from 46 the previous month. Any number below 50 indicates that more builders view sales conditions as poor than good.
----- Friday, January 17th -----
 8:30 AM: Housing Starts for December.
This graph shows single and multi-family housing starts since 1968.
The consensus is for 1.315 million SAAR, up from 1.289 million SAAR.
 9:15 AM: The Fed will release Industrial Production and Capacity Utilization for December.
This graph shows industrial production since 1967.
The consensus is for a 0.3% increase in Industrial Production, and for Capacity Utilization to increase to 77.0%.
 8:30 AM: Housing Starts for December.
 This graph shows single and multi-family housing starts since 1968.
The consensus is for 1.315 million SAAR, up from 1.289 million SAAR.
 9:15 AM: The Fed will release Industrial Production and Capacity Utilization for December.
This graph shows industrial production since 1967.
The consensus is for a 0.3% increase in Industrial Production, and for Capacity Utilization to increase to 77.0%.
Friday, January 10, 2025
Goldman on Employment Report and FOMC
by Calculated Risk on 1/10/2025 04:05:00 PM
A few excerpts from a Goldman Sachs research note:
Nonfarm payrolls rose 256k in December, well above consensus expectations. ... The household survey was also strong. The unemployment rate fell 0.15pp to 4.09%, reflecting a 478k gain in household employment and an unchanged labor force participation rate, at 62.5%. ... Following this morning’s data, we now expect the FOMC to deliver two 25bp cuts this year (vs. three previously) at its June and December meetings, followed by another cut in June 2026, to an unchanged terminal rate of 3.5-3.75%.Market participants also expect the next FOMC rate cut in June (it is a close call), but only one rate cut in 2025 (close to two).
Q4 GDP Tracking: 1.8% to 2.7% Range
by Calculated Risk on 1/10/2025 01:02:00 PM
From BofA:
Since our last weekly publication, our 4Q GDP tracking estimate has moved down three tenths to 1.8% q/q saar. The final estimate of 3Q GDP came in at 3.1% q/q saar, close to our tracking of 3.0%. [Jan 10th estimate]From Goldman:
emphasis added
We left our Q4 GDP tracking estimate unchanged at +2.3% (quarter-over-quarter annualized) and our Q4 domestic final sales forecast unchanged at +2.3%. [Jan 7th estimate]And from the Atlanta Fed: GDPNow
The GDPNow model estimate for real GDP growth (seasonally adjusted annual rate) in the fourth quarter of 2024 is 2.7 percent on January 9, unchanged from January 7 after rounding. After the wholesale trade report from the US Census Bureau, the nowcast of fourth-quarter real gross private domestic investment growth increased from -0.6 percent to -0.4 percent. [Jan 9th estimate]
Comments on December Employment Report
by Calculated Risk on 1/10/2025 09:47:00 AM
The headline jobs number in the December employment report was well above expectations, however, October and November payrolls were revised down by 8,000 combined. The participation rate was unchanged, the employment population ratio increased, and the unemployment rate decreased to 4.1%.
Prime (25 to 54 Years Old) Participation
 Since the overall participation rate is impacted by both cyclical (recession) and demographic (aging population, younger people staying in school) reasons, here is the employment-population ratio for the key working age group: 25 to 54 years old.
The 25 to 54 years old participation rate decreased in December at 83.4% from 83.5% in November.
The 25 to 54 employment population ratio increased to 80.5% from 80.4% the previous month.
Both are down from the recent peaks, but still near the highest level this millennium.
Average Hourly Wages
 The graph shows the nominal year-over-year change in "Average Hourly Earnings" for all private employees from the Current Employment Statistics (CES).
Average Hourly Wages
 The graph shows the nominal year-over-year change in "Average Hourly Earnings" for all private employees from the Current Employment Statistics (CES).
 There was a huge increase at the beginning of the pandemic as lower paid employees were let go, and then the pandemic related spike reversed a year later.
Wage growth has trended down after peaking at 5.9% YoY in March 2022 and was at 3.9% YoY in December.
Wage growth has trended down after peaking at 5.9% YoY in March 2022 and was at 3.9% YoY in December.
Part Time for Economic Reasons
 From the BLS report:
"The number of people employed part time for economic reasons, at 4.4 million, changed little in December and is little different from a year earlier. These individuals would have preferred full-time employment but were working part time because their hours had been reduced or they were unable to find full-time jobs."The number of persons working part time for economic reasons decreased in December to 4.36 million from 4.47 million in November. This is close to the pre-pandemic levels.
These workers are included in the alternate measure of labor underutilization (U-6) that decreased to 7.5% from 7.7% in the previous month. This is down from the record high in April 2020 of 22.9% and up from the lowest level on record (seasonally adjusted) in December 2022 (6.6%). (This series started in 1994). This measure is above the 7.0% level in February 2020 (pre-pandemic).
Unemployed over 26 Weeks
 This graph shows the number of workers unemployed for 27 weeks or more.
 According to the BLS, there are 1.51 million workers who have been unemployed for more than 26 weeks and still want a job, down from 1.65 million the previous month.
This is down from post-pandemic high of 4.171 million, and up from the recent low of 1.056 million.
This is above pre-pandemic levels.
Job Streak
Summary:
The headline jobs number in the December employment report was well above expectations, however, October and November payrolls were revised down by 8,000 combined. The participation rate was unchanged, the employment population ratio increased, and the unemployment rate decreased to 4.1%.
This is above pre-pandemic levels.
Job Streak
Through December 2024, the employment report indicated positive job growth for 48 consecutive months, putting the current streak in 2nd place of the longest job streaks in US history (since 1939). It appears this streak will survive the annual benchmark revision (that will revise down job growth).
| Headline Jobs, Top 10 Streaks | ||
|---|---|---|
| Year Ended | Streak, Months | |
| 1 | 2020 | 113 |
| 2 tie | 20241 | 48 |
| 2 tie | 1990 | 48 |
| 4 | 2007 | 46 |
| 5 | 1979 | 45 |
| 6 tie | 1943 | 33 |
| 6 tie | 1986 | 33 |
| 6 tie | 2000 | 33 |
| 9 | 1967 | 29 |
| 10 | 1995 | 25 |
| 1Currrent Streak | ||
Summary:
The headline jobs number in the December employment report was well above expectations, however, October and November payrolls were revised down by 8,000 combined. The participation rate was unchanged, the employment population ratio increased, and the unemployment rate decreased to 4.1%.
A strong employment report.
December Employment Report: 256 thousand Jobs, 4.1% Unemployment Rate
by Calculated Risk on 1/10/2025 08:30:00 AM
From the BLS: Employment Situation
Total nonfarm payroll employment increased by 256,000 in December, and the unemployment rate changed little at 4.1 percent, the U.S. Bureau of Labor Statistics reported today. Employment trended up in health care, government, and social assistance. Retail trade added jobs in December, following a job loss in November.
...
The change in total nonfarm payroll employment for October was revised up by 7,000, from +36,000 to +43,000, and the change for November was revised down by 15,000, from +227,000 to +212,000. With these revisions, employment in October and November combined is 8,000 lower than previously reported.
emphasis added
 Click on graph for larger image.
The first graph shows the jobs added per month since January 2021.
Total payrolls increased by 256 thousand in December. Private payrolls increased by 223 thousand, and public payrolls increased 33 thousand.
Payrolls for October and November were revised down 8 thousand, combined.
Payrolls for October and November were revised down 8 thousand, combined.
 The second graph shows the year-over-year change in total non-farm employment since 1968.
In December, the year-over-year change was 2.23 million jobs. Employment was up solidly year-over-year (Although the annual benchmark revision will lower the year-over-year change).
The third graph shows the employment population ratio and the participation rate.
 The Labor Force Participation Rate was unchanged at 62.5% in December, from 62.5% in November. This is the percentage of the working age population in the labor force.
 The Employment-Population ratio increased to 60.0% from 59.8% in November (blue line).
I'll post the 25 to 54 age group employment-population ratio graph later.
 The fourth graph shows the unemployment rate.
 The unemployment rate decreased to 4.1% in December from 4.2% in November.
This was well above consensus expectations; however, October and November payrolls were revised down by 8,000 combined.
Thursday, January 09, 2025
Friday: Employment Report
by Calculated Risk on 1/09/2025 07:46:00 PM
 Note: Mortgage rates are from MortgageNewsDaily.com and are for top tier scenarios.
Friday:
• At 8:30 AM ET, Employment Report for December. The consensus is for 160,000 jobs added, and for the unemployment rate to be unchanged at 4.2%.
• At 10:00 AM, University of Michigan's Consumer sentiment index (Preliminary for January)
• At 8:30 AM ET, Employment Report for December. The consensus is for 160,000 jobs added, and for the unemployment rate to be unchanged at 4.2%.
• At 10:00 AM, University of Michigan's Consumer sentiment index (Preliminary for January)
The Housing Bubble and Mortgage Debt as a Percent of GDP
by Calculated Risk on 1/09/2025 11:44:00 AM
Today, in the Calculated Risk Real Estate Newsletter: Update: The Housing Bubble and Mortgage Debt as a Percent of GDP
A brief excerpt:
Two years ago, I wrote The Housing Bubble and Mortgage Debt as a Percent of GDP. Here is an update to a couple of graphs. The bottom line remains the same: There will not be cascading price declines in this cycle due to distressed sales.There is much more in the article.
In a 2005 post, I included a graph of household mortgage debt as a percent of GDP. Several readers asked if I could update the graph.
First, from February 2005 (20 years ago!):The following chart shows household mortgage debt as a % of GDP. Although mortgage debt has been increasing for years, the last four years have seen a tremendous increase in debt. Last year alone mortgage debt increased close to $800 Billion - almost 7% of GDP. ...And a serious problem is what happened!
Many homeowners have refinanced their homes, in essence using their homes as an ATM.
It wouldn't take a RE bust to impact the general economy. Just a slowdown in both volume (to impact employment) and in prices (to slow down borrowing) might push the general economy into recession. An actual bust, especially with all of the extensive sub-prime lending, might cause a serious problem.


