 RSS Feed
 by Calculated Risk on 2/07/2025 09:18:00 AM
Friday, February 07, 2025
Comments on January Employment Report
The headline jobs number in the January employment report was below expectations, however, November and December payrolls were revised up by 100,000 combined. The participation rate and the employment population ratio increased, and the unemployment rate decreased to 4.0%.
Prime (25 to 54 Years Old) Participation
 Since the overall participation rate is impacted by both cyclical (recession) and demographic (aging population, younger people staying in school) reasons, here is the employment-population ratio for the key working age group: 25 to 54 years old.
The 25 to 54 years old participation rate decreased in January at 83.5% from 83.4% in December.
The 25 to 54 employment population ratio increased to 80.7% from 80.5% the previous month.
Both are down from the recent peaks, but still near the highest level this millennium.
Average Hourly Wages
 The graph shows the nominal year-over-year change in "Average Hourly Earnings" for all private employees from the Current Employment Statistics (CES).
Average Hourly Wages
 The graph shows the nominal year-over-year change in "Average Hourly Earnings" for all private employees from the Current Employment Statistics (CES).
 There was a huge increase at the beginning of the pandemic as lower paid employees were let go, and then the pandemic related spike reversed a year later.
Wage growth has trended down after peaking at 5.9% YoY in March 2022 and was at 4.1% YoY in January.
Wage growth has trended down after peaking at 5.9% YoY in March 2022 and was at 4.1% YoY in January.
Part Time for Economic Reasons
 From the BLS report:
"The number of people employed part time for economic reasons, at 4.5 million, changed little in January. These individuals would have preferred full-time employment but were working part time because their hours had been reduced or they were unable to find full-time jobs."The number of persons working part time for economic reasons increased in January to 4.48 million from 4.36 million in December. This is close to the pre-pandemic levels.
These workers are included in the alternate measure of labor underutilization (U-6) that was unchanged at 7.5% from 7.5% in the previous month. This is down from the record high in April 2020 of 22.9% and up from the lowest level on record (seasonally adjusted) in December 2022 (6.6%). (This series started in 1994). This measure is above the 7.0% level in February 2020 (pre-pandemic).
Unemployed over 26 Weeks
 This graph shows the number of workers unemployed for 27 weeks or more.
 According to the BLS, there are 1.44 million workers who have been unemployed for more than 26 weeks and still want a job, down from 1.51 million the previous month.
This is down from post-pandemic high of 4.171 million, and up from the recent low of 1.056 million.
This is above pre-pandemic levels.
Job Streak
Summary:
The headline jobs number in the January employment report was below expectations, however, November and December payrolls were revised up by 100,000 combined. The participation rate and the employment population ratio increased, and the unemployment rate decreased to 4.0%.
This is above pre-pandemic levels.
Job Streak
Through January 2025, the employment report indicated positive job growth for 49 consecutive months, putting the current streak in 2nd place of the longest job streaks in US history (since 1939). This streak survived the annual benchmark revision.
| Headline Jobs, Top 10 Streaks | ||
|---|---|---|
| Year Ended | Streak, Months | |
| 1 | 2020 | 113 |
| 2 | N/A | 491 |
| 3 | 1990 | 48 |
| 4 | 2007 | 46 |
| 5 | 1979 | 45 |
| 6 tie | 1943 | 33 |
| 6 tie | 1986 | 33 |
| 6 tie | 2000 | 33 |
| 9 | 1967 | 29 |
| 10 | 1995 | 25 |
| 1Currrent Streak | ||
Summary:
The headline jobs number in the January employment report was below expectations, however, November and December payrolls were revised up by 100,000 combined. The participation rate and the employment population ratio increased, and the unemployment rate decreased to 4.0%.
Another decent employment report.
January Employment Report: 143 thousand Jobs, 4.0% Unemployment Rate
by Calculated Risk on 2/07/2025 08:30:00 AM
From the BLS: Employment Situation
Total nonfarm payroll employment rose by 143,000 in January, and the unemployment rate edged down to 4.0 percent, the U.S. Bureau of Labor Statistics reported today. Job gains occurred in health care, retail trade, and social assistance. Employment declined in the mining, quarrying, and oil and gas extraction industry.
...
The change in total nonfarm payroll employment for November was revised up by 49,000, from +212,000 to +261,000, and the change for December was revised up by 51,000, from +256,000 to +307,000. With these revisions, employment in November and December combined is 100,000 higher than previously reported.
emphasis added
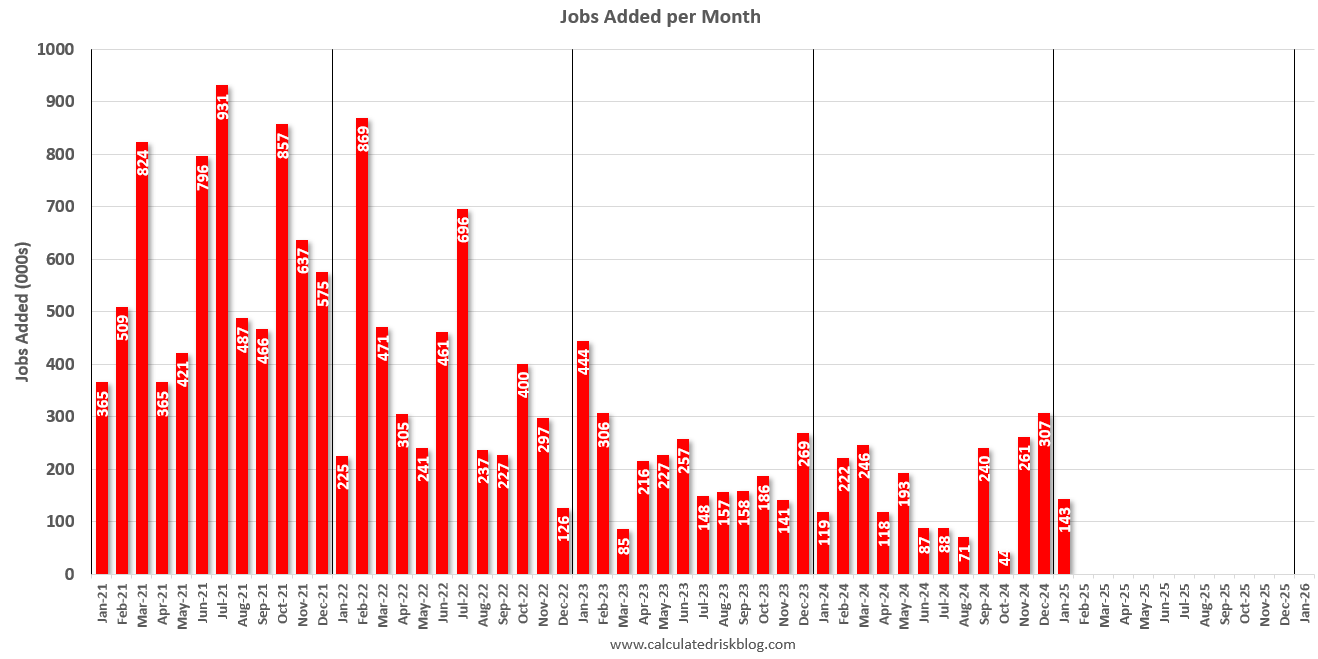 Click on graph for larger image.
The first graph shows the jobs added per month since January 2021.
Total payrolls increased by 143 thousand in January. Private payrolls increased by 111 thousand, and public payrolls increased 32 thousand.
Payrolls for November and December were revised up 100 thousand, combined.
Payrolls for November and December were revised up 100 thousand, combined.
 The second graph shows the year-over-year change in total non-farm employment since 1968.
In January, the year-over-year change was 2.02 million jobs. Employment was up solidly year-over-year.
The third graph shows the employment population ratio and the participation rate.
 The Labor Force Participation Rate was increased to 62.6% in January, from 62.5% in December. This is the percentage of the working age population in the labor force.
 The Employment-Population ratio increased to 60.1% from 60.0% in December (blue line).
I'll post the 25 to 54 age group employment-population ratio graph later.
 The fourth graph shows the unemployment rate.
 The unemployment rate decreased to 4.0% in January from 4.1% in December.
This was below consensus expectations; however, November and December payrolls were revised up by 100,000 combined.
The seasonally adjusted total nonfarm employment level for March 2024 was revised downward by 589,000. On a not seasonally adjusted basis, the total nonfarm employment level for March 2024 was revised downward by 598,000, or -0.4 percent. Not seasonally adjusted, the absolute average benchmark revision over the past 10 years is 0.1 percent.I'll have more later ...
Thursday, February 06, 2025
Friday: Employment Report
by Calculated Risk on 2/06/2025 07:48:00 PM
 Note: Mortgage rates are from MortgageNewsDaily.com and are for top tier scenarios.
Friday:
• At 8:30 AM: Employment Report for December. The consensus is for 170,000 jobs added, and for the unemployment rate to be unchanged at 4.1%.
NOTE: For the household survey, new population controls will be used - and this will boost overall household employment. For the establishment survey, the annual benchmark revision will be included, lowering past job growth.
10:00 AM: University of Michigan's Consumer sentiment index (Preliminary for January).
Predicting the Next Recession
by Calculated Risk on 2/06/2025 05:39:00 PM
Over a decade ago, in 2013, I wrote a post "Predicting the Next Recession. That post was in response to several recession forecasts (that were incorrect).
In that post, I noted that the next recession would likely be caused by one of the following:
• "An exogenous event such as a pandemic, significant military conflict, disruption of energy supplies for any reason, a major natural disaster (meteor strike, super volcano, etc), and a number of other low probability reasons. All of these events are possible, but they are unpredictable, and the probabilities are low that they will happen in the next few years or even decades." emphasis added
Unfortunately, in 2020, one of those low probability events happened (pandemic), and that led to a recession in 2020. Another exogenous event is possible, but unpredictable.
• Significant executive / fiscal policy error.
During the previous Trump administration, we saw several policy errors, like the failed TCJA (Tax Cut and Jobs Act), but none that were significant enough to take the economy into a recession (I stayed positive on the economy back then).
During the previous Trump administration, we saw several policy errors, like the failed TCJA (Tax Cut and Jobs Act), but none that were significant enough to take the economy into a recession (I stayed positive on the economy back then).
• Monetary policy error. As I noted in 2013: "Most of the post-WWII recessions were caused by the Fed tightening monetary policy to slow inflation."
A monetary policy error was the concern over the last couple of years, and it appears the Fed has mostly achieved a soft landing (as I expected). Earlier I defined a successful "soft landing" as follows: "a soft landing is achieved if growth stays positive, inflation returns to target, and the yield curve flattens or reverts to normal (long yields higher than short yields)." Growth has stayed positive, the yield curve has reverted to normal, but inflation is still a little above target (two out of three ain't bad).
Now the key concern is significant executive / fiscal policy errors. Although there have been concerning developments over the last 2+ weeks (for example, scrubbing websites of important information for health issues and climate change, eliminating ethic rules, and on and on), those will have little impact on the economy in the short term.
However, tariffs, immigration policy and wanton fiscal cuts and Federal employee layoffs could negatively impact the economy.
I'm not currently on recession watch, but there is an increasing concern.
January Employment Preview
by Calculated Risk on 2/06/2025 03:05:00 PM
On Friday at 8:30 AM ET, the BLS will release the employment report for January. The consensus is for 170,000 jobs added, and for the unemployment rate to be unchanged at 4.1%.
There were 256,000 jobs added in December, and the unemployment rate was at 4.1%.
From Goldman Sachs:
• ISM Surveys: Note that the ISM indexes are diffusion indexes based on the number of firms hiring (not the number of hires). The ISM® manufacturing employment index increased to 50.3%, up from 45.4% the previous month. This would suggest about 15,000 jobs lost in manufacturing. The ADP report indicated 13,000 manufacturing jobs lost in January.
The ISM® services employment index increased to 52.3%, from 51.3%. This would suggest 110,000 jobs added in the service sector. Combined this suggests 95,000 jobs added, far below consensus expectations. (Note: The ISM surveys have been way off recently)
• Unemployment Claims: The weekly claims report showed slightly more initial unemployment claims during the reference week at 223,000 in January compared to 220,000 in December. This suggests slightly more layoffs in January compared to December.
We estimate nonfarm payrolls rose by 190k in January, above consensus of +170k ... We assume that the Los Angeles wildfires and colder-than-usual weather will each subtract 20k from January job growth. ... We estimate that the unemployment rate was unchanged at 4.1%, in line with consensusFrom BofA:
emphasis added
We forecast a 200k increase in nonfarm payrolls (170k private) in Jan. The u-rate should remain steady at 4.1%. The Jan jobs report will be impacted by the wildfires & snowstorms, potential residual seasonality, and annual revisions.• ADP Report: The ADP employment report showed 183,000 private sector jobs were added in January. This was above consensus forecasts and suggests job gains above consensus expectations, however, in general, ADP hasn't been very useful in forecasting the BLS report.
• ISM Surveys: Note that the ISM indexes are diffusion indexes based on the number of firms hiring (not the number of hires). The ISM® manufacturing employment index increased to 50.3%, up from 45.4% the previous month. This would suggest about 15,000 jobs lost in manufacturing. The ADP report indicated 13,000 manufacturing jobs lost in January.
The ISM® services employment index increased to 52.3%, from 51.3%. This would suggest 110,000 jobs added in the service sector. Combined this suggests 95,000 jobs added, far below consensus expectations. (Note: The ISM surveys have been way off recently)
• Unemployment Claims: The weekly claims report showed slightly more initial unemployment claims during the reference week at 223,000 in January compared to 220,000 in December. This suggests slightly more layoffs in January compared to December.
• Conclusion: Over the last 9 months, employment gains averaged 160 thousand per month - and that is probably the current trend. With some impact from the cold weather, my guess is headline employment will be less than consensus in January.
MBA: Mortgage Delinquencies Increased Slightly in Q4 2024
by Calculated Risk on 2/06/2025 12:13:00 PM
Today, in the Calculated Risk Real Estate Newsletter: MBA: Mortgage Delinquencies Increased Slightly in Q4 2024
A brief excerpt:
From the MBA: Mortgage Delinquencies Increase in the Fourth Quarter of 2024There is much more in the article.The delinquency rate for mortgage loans on one-to-four-unit residential properties increased to a seasonally adjusted rate of 3.98 percent of all loans outstanding at the end of the fourth quarter of 2024, according to the Mortgage Bankers Association’s (MBA) National Delinquency Survey.The following graph shows the percent of loans delinquent by days past due. Overall delinquencies increased in Q2. The sharp increase in 2020 in the 90-day bucket was due to loans in forbearance (included as delinquent, but not reported to the credit bureaus).
The percent of loans in the foreclosure process decreased year-over-year from 0.47 percent in Q4 2023 to 0.45 percent in Q4 2024 (red) and remains historically low.
...
The primary concern is the increase in FHA and VA delinquency rates. Some of the increase is probably due to the hurricanes last year.
We will likely see an increase in 30-day delinquencies in Q1 2025 due to the wildfires in California.

CoreLogic: US Home Prices Increased 3.4% Year-over-year in December
by Calculated Risk on 2/06/2025 11:08:00 AM
Notes: This CoreLogic House Price Index report is for December. The recent Case-Shiller index release was for November. The CoreLogic HPI is a three-month weighted average and is not seasonally adjusted (NSA).
From CoreLogic: CoreLogic: Home Price Growth Ticks Up Slightly in December
• The national home price gain was 3.4% year over year in November 2024, down from the 5.2% growth recorded in the same month of 2023.This was the same YoY increase as reported for November.
• The national home price gain was 3.4% year over year in December 2024, down from the 5.6% growth recorded in the final month of 2023.
• Home prices are projected to rise by 4.1% annually by December 2025.
• Northeastern states again showed strong annual price appreciation in December.
...
U.S. home price gains showed a slight marginal uptick to 3.4% year over year in December, though the uptick mostly reflects weak 2023 year-end. Otherwise, home price appreciation has been almost flat since the typically busy fall selling season began in September. ...
“Home prices have remained flat since the housing market began seeing slower activity this past summer," said CoreLogic Chief Economist Dr. Selma Hepp. "Bifurcation across markets has also persisted. Northeastern markets drove appreciation growth due to low inventories of homes for sale while Southern markets readjusted to higher inventories and increases in variable mortgage costs, such as taxes and insurance. Home prices are also cooling in the markets in Mountain West, which have been trying to find stability over the last year following the surge in mortgage rates and price declines from pandemic highs. Despite the difficult housing markets conditions in 2024, home prices increased about 4.5% over the course of the year, a small jump compared to the 4.1% uptick in 2023. Going forward, with inventories slowing improving and mortgage rates remaining elevated, forecasts suggest a smaller overall increase in prices in 2025.”
emphasis added
This map is from the report.

Nationally, home prices increased by 3.4% year over year in December. The state of Hawaii and the District of Colombia both posted annual home price declines of -1.1% and -0.7%, respectively. The states with the highest increases year over year were Connecticut (up by 7.8%) and New Jersey (up by 7.7%).
Weekly Initial Unemployment Claims Increase to 219,000
by Calculated Risk on 2/06/2025 08:30:00 AM
The DOL reported:
In the week ending February 1, the advance figure for seasonally adjusted initial claims was 219,000, an increase of 11,000 from the previous week's revised level. The previous week's level was revised up by 1,000 from 207,000 to 208,000. The 4-week moving average was 216,750, an increase of 4,000 from the previous week's revised average. The previous week's average was revised up by 250 from 212,500 to 212,750.The following graph shows the 4-week moving average of weekly claims since 1971.
emphasis added
 Click on graph for larger image.
The dashed line on the graph is the current 4-week average. The four-week average of weekly unemployment claims increased to 216,750.
The previous week was revised up.
Weekly claims were above the consensus forecast.
Wednesday, February 05, 2025
Thursday: Unemployment Claims
by Calculated Risk on 2/05/2025 07:32:00 PM
 Note: Mortgage rates are from MortgageNewsDaily.com and are for top tier scenarios.
Thursday:
• At 8:30 AM ET, The initial weekly unemployment claims report will be released. The consensus is for a increase to 214 thousand from 207 thousand last week.
The Changing Mix of Light Vehicle Sales
by Calculated Risk on 2/05/2025 03:31:00 PM
An update: The first graph below shows the mix of sales since 1976 (Blue is cars, Red is light trucks and SUVs) through January 2025.

Click on graph for larger image.
The mix has changed significantly. Back in 1976, most light vehicles were passenger cars - however passenger car sales have trended down over time.
Note that the big dips in sales are related to economic recessions (early '80s, early '90s, the Great Recession of 2007 through mid-2009 and the pandemic in 2020).
The second graph shows the percent of light vehicle sales between passenger cars and trucks / SUVs.
 Over time the mix has changed toward more and more light trucks and SUVs. Only when oil prices are high, does the trend slow or reverse.
Currently a record 82% of light vehicle sales are light trucks or SUVs.


