 RSS Feed
 by Calculated Risk on 2/20/2025 08:30:00 AM
Thursday, February 20, 2025
Weekly Initial Unemployment Claims Increase to 219,000
The DOL reported:
In the week ending February 15, the advance figure for seasonally adjusted initial claims was 219,000, an increase of 5,000 from the previous week's revised level. The previous week's level was revised up by 1,000 from 213,000 to 214,000. The 4-week moving average was 215,250, a decrease of 1,000 from the previous week's revised average. The previous week's average was revised up by 250 from 216,000 to 216,250.The following graph shows the 4-week moving average of weekly claims since 1971.
emphasis added
 Click on graph for larger image.
The dashed line on the graph is the current 4-week average. The four-week average of weekly unemployment claims decreased to 215,250.
The previous week was revised up.
Weekly claims were above the consensus forecast.
Wednesday, February 19, 2025
Thursday: Unemployment Claims, Philly Fed Mfg
by Calculated Risk on 2/19/2025 07:24:00 PM
 Note: Mortgage rates are from MortgageNewsDaily.com and are for top tier scenarios.
Thursday:
• At 8:30 AM ET, The initial weekly unemployment claims report will be released. The consensus is for an increase to 216 thousand from 213 thousand last week.
• Also at 8:30 AM, The Philly Fed manufacturing survey for February. The consensus is for a reading of 25.4, down from 44.3.
AIA: Architecture Billings "Billings remain soft to start the new year"
by Calculated Risk on 2/19/2025 04:01:00 PM
Note: This index is a leading indicator primarily for new Commercial Real Estate (CRE) investment.
From the AIA: ABI January 2025: Architecture firm billings remain soft to start the new year
The AIA/Deltek Architecture Billings Index (ABI) score was 45.6 for the month, slightly above the December score. This means that while a majority of firms still saw their billings decrease in January, the share of firms experiencing that decrease was slightly smaller than in December. Inquiries into new projects continued to grow at the same slow pace as in recent months, but the value of newly signed design contracts declined for the eleventh consecutive month as clients remained cautious about committing to new projects during the ongoing economic uncertainty. (Note that every January, the seasonal adjustment factors for all ABI data series are revised, leading to revisions in recent historical data.)• Northeast (41.1); Midwest (45.6); South (46.0); West (48.8)
Billings were also soft at firms in all regions of the country in January. Firms located in the West saw very modest billings growth in the fourth quarter of 2024, but unfortunately, billings returned to negative territory to start the new year. Business conditions remained softest at firms located in the Northeast, which has been the trend in recent months. And billings softened further at firms located in the South, which saw more encouraging signs last fall, before weakening again. Billings also declined at firms of all specializations in January. Firms with a commercial/industrial specialization continued to be most likely to report softening business conditions, but billings have weakened at firms of all specializations in recent months.
...
The ABI score is a leading economic indicator of construction activity, providing an approximately nine-to-twelve-month glimpse into the future of nonresidential construction spending activity. The score is derived from a monthly survey of architecture firms that measures the change in the number of services provided to clients.
emphasis added
• Sector index breakdown: commercial/industrial (43.1); institutional (47.4); multifamily residential (45.0)
 Click on graph for larger image.
This graph shows the Architecture Billings Index since 1996. The index was at 45.6 in January, up from 44.1 in December. Anything below 50 indicates a decrease in demand for architects' services.
This index has indicated contraction for 26 of the last 28 months.
Note: This includes commercial and industrial facilities like hotels and office buildings, multi-family residential, as well as schools, hospitals and other institutions.
This index usually leads CRE investment by 9 to 12 months, so this index suggests a slowdown in CRE investment in 2025.
Note: This includes commercial and industrial facilities like hotels and office buildings, multi-family residential, as well as schools, hospitals and other institutions.
This index usually leads CRE investment by 9 to 12 months, so this index suggests a slowdown in CRE investment in 2025.
Multi-family billings remained negative has been negative for the last 30 months. This suggests we will see further weakness in multi-family starts.
FOMC Minutes: Concern about tariffs, "take time" on any additional Rate Cuts
by Calculated Risk on 2/19/2025 02:00:00 PM
From the Fed: Minutes of the Federal Open Market Committee, January 28–29, 2025. Excerpt:
With regard to the outlook for inflation, participants expected that, under appropriate monetary policy, inflation would continue to move toward 2 percent, although progress could remain uneven. Participants cited various factors as likely to put continuing downward pressure on inflation, including an easing in nominal wage growth, well-anchored longer-term inflation expectations, waning business pricing power, and the Committee's still-restrictive monetary policy stance. A few noted, however, that the current target range for the federal funds rate may not be far above its neutral level. Furthermore, some participants commented that with supply and demand in the labor market roughly in balance and in light of recent productivity gains, labor market conditions were unlikely to be a source of inflationary pressure in the near future. However, other factors were cited as having the potential to hinder the disinflation process, including the effects of potential changes in trade and immigration policy as well as strong consumer demand. Business contacts in a number of Districts had indicated that firms would attempt to pass on to consumers higher input costs arising from potential tariffs. In addition, some participants noted that some market- or survey-based measures of expected inflation had increased recently, although many participants emphasized that longer-term measures of expected inflation had remained well anchored. Some participants remarked that reported inflation at the beginning of the year was harder than usual to interpret because of the difficulties in fully removing seasonal effects, and a couple of participants commented that any increase in reported inflation in the first quarter due to such difficulties would imply a corresponding decrease in reported inflation in other quarters of the year.
...
In discussing the outlook for monetary policy, participants observed that the Committee was well positioned to take time to assess the evolving outlook for economic activity, the labor market, and inflation, with the vast majority pointing to a still-restrictive policy stance. Participants indicated that, provided the economy remained near maximum employment, they would want to see further progress on inflation before making additional adjustments to the target range for the federal funds rate. Participants noted that policy decisions were not on a preset course and were conditional on the evolution of the economy, the economic outlook, and the balance of risks.
emphasis added
Newsletter: Housing Starts Decreased to 1.366 million Annual Rate in January
by Calculated Risk on 2/19/2025 09:17:00 AM
Today, in the Calculated Risk Real Estate Newsletter: Housing Starts Decreased to 1.366 million Annual Rate in January
A brief excerpt:
Total housing starts in January were below expectations; however, starts in November and December were revised up.There is much more in the article.
The third graph shows the month-to-month comparison for total starts between 2024 (blue) and 2025 (red).
Total starts were down 0.7% in January compared to January 2024. There were significant regional differences in January with starts in the Northeast region down sharply year-over-year (likely weather related).
Single family starts have been up year-over-year in 14 of the last 19 months, whereas multi-family has been up year-over-year in only 4 of last 20 months.

Housing Starts Decreased to 1.366 million Annual Rate in January
by Calculated Risk on 2/19/2025 08:30:00 AM
From the Census Bureau: Permits, Starts and Completions
Housing Starts:
Privately-owned housing starts in January were at a seasonally adjusted annual rate of 1,366,000. This is 9.8 percent below the revised December estimate of 1,515,000 and is 0.7 percent below the January 2024 rate of 1,376,000. Single-family housing starts in January were at a rate of 993,000; this is 8.4 percent below the revised December figure of 1,084,000. The January rate for units in buildings with five units or more was 355,000.
Building Permits:
Privately-owned housing units authorized by building permits in January were at a seasonally adjusted annual rate of 1,483,000. This is 0.1 percent above the revised December rate of 1,482,000, but is 1.7 percent below the January 2024 rate of 1,508,000. Single-family authorizations in January were at a rate of 996,000; this is virtually unchanged from the revised December figure of 996,000. Authorizations of units in buildings with five units or more were at a rate of 427,000 in January.
emphasis added
 Click on graph for larger image.
The first graph shows single and multi-family housing starts since 2000.
Multi-family starts (blue, 2+ units) decreased month-over-month in January. Multi-family starts were up 2.2% year-over-year.
Single-family starts (red) decreased in January and were down 1.8% year-over-year.
 The second graph shows single and multi-family housing starts since 1968.
 This shows the huge collapse following the housing bubble, and then the eventual recovery - and the recent collapse and recovery in single-family starts.
Total housing starts in January were below expectations; however, starts in November and December were revised up.
I'll have more later …
MBA: Mortgage Applications Decrease in Latest MBA Weekly Survey
by Calculated Risk on 2/19/2025 07:00:00 AM
From the MBA: Mortgage Applications Decrease in Latest MBA Weekly Survey
Mortgage applications decreased 6.6 percent from one week earlier, according to data from the Mortgage Bankers Association’s (MBA) Weekly Mortgage Applications Survey for the week ending February 14, 2025.
The Market Composite Index, a measure of mortgage loan application volume, decreased 6.6 percent on a seasonally adjusted basis from one week earlier. On an unadjusted basis, the Index decreased 4 percent compared with the previous week. The Refinance Index decreased 7 percent from the previous week and was 39 percent higher than the same week one year ago. The seasonally adjusted Purchase Index decreased 6 percent from one week earlier. The unadjusted Purchase Index decreased 1 percent compared with the previous week and was 7 percent higher than the same week one year ago.
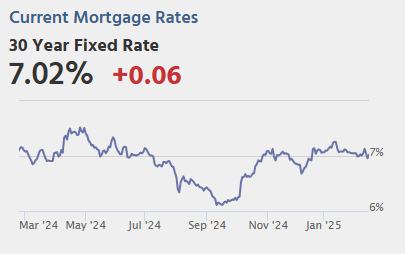
“Mortgage rates decreased on average over the week, as markets brushed off unexpectedly strong inflation data. Despite mortgage rates declining, with the 30-year fixed mortgage rate dropping to 6.93 percent, mortgage applications decreased to their slowest pace since the beginning of the year,” said Joel Kan, MBA’s Vice President and Deputy Chief Economist. “Purchase applications were down for the week, as buyers remained on the fence, although loosening inventory may help support activity in the coming months. Refinance applications had been rising in previous weeks but dipped as rates remained close to 7 percent.”
...
The average contract interest rate for 30-year fixed-rate mortgages with conforming loan balances ($766,550 or less) decreased to 6.93 percent from 6.95 percent, with points increasing to 0.66 from 0.64 (including the origination fee) for 80 percent loan-to-value ratio (LTV) loans.
emphasis added
 Click on graph for larger image.
The first graph shows the MBA mortgage purchase index.
According to the MBA, purchase activity is up 7% year-over-year unadjusted.
Red is a four-week average (blue is weekly).
Purchase application activity is up about 15% from the lows in late October 2023 and is now 5% below the lowest levels during the housing bust.

The second graph shows the refinance index since 1990.
The refinance index remains very low.
Tuesday, February 18, 2025
Wednesday: Housing Starts, FOMC Minutes
by Calculated Risk on 2/18/2025 07:03:00 PM
 Note: Mortgage rates are from MortgageNewsDaily.com and are for top tier scenarios.
Wednesday:
• At 7:00 AM ET, The Mortgage Bankers Association (MBA) will release the mortgage purchase applications index.
• At 8:30 AM, Housing Starts for January. The consensus is for 1.394 million SAAR, down from 1.499 million SAAR.
• During the day, The AIA's Architecture Billings Index for January (a leading indicator for commercial real estate).
• At 2:00 PM, FOMC Minutes, Meeting of Meeting of January 28-29, 2025
MBA Survey: Share of Mortgage Loans in Forbearance Decreases to 0.40% in January
by Calculated Risk on 2/18/2025 02:16:00 PM
From the MBA:
Share of Mortgage Loans in Forbearance Decreases to 0.40% in January
The Mortgage Bankers Association’s (MBA) monthly Loan Monitoring Survey revealed that the total number of loans now in forbearance decreased by 7 basis points from 0.47% of servicers’ portfolio volume in the prior month to 0.40% as of January 31, 2025. According to MBA’s estimate, 200,000 homeowners are in forbearance plans.At the end of January, there were about 200,000 homeowners in forbearance plans.
The share of Fannie Mae and Freddie Mac loans in forbearance decreased 2 basis points to 0.17% in January 2025. Ginnie Mae loans in forbearance decreased by 19 basis points to 0.88%, and the forbearance share for portfolio loans and private-label securities (PLS) remained the same as the prior month at 0.40%.
“While the number of forbearance requests grew in January, the number of forbearance exits outweighed that pick-up, reaching the highest level since June 2022,” said Marina Walsh, CMB, MBA’s Vice President of Industry Analysis. “This outcome was somewhat surprising given the recent events in California, but it speaks to recovery in other parts of the country affected by natural disasters and the movement of aged government loans out of forbearance.”
Added Walsh, “As the number of borrowers in forbearance dropped this past month, the number of borrowers with permanent loan workouts grew. Today, approximately 6.5 percent of all borrowers – or 3.3 million homeowners – are in a loan workout completed in 2020 or after.”
...
By reason, 64.1% of borrowers are in forbearance for reasons such as a temporary hardship caused by job loss, death, divorce, or disability. Another 32.9% are in forbearance because of a natural disaster. The remaining 3.0% of borrowers are still in forbearance because of COVID-19.
emphasis added
The "Neutral" Rate and Implications for 30-year Mortgage Rates
by Calculated Risk on 2/18/2025 12:24:00 PM
Today, in the Calculated Risk Real Estate Newsletter: The "Neutral" Rate and Implications for 30-year Mortgage Rates
A brief excerpt:
Housing economist Tom Lawler has written extensively on the neutral rate. He has argued that the neutral rate has increased back to pre-financial crisis levels and that it seems like that “the current stance of monetary policy is not meaningfully restrictive”.There is much more in the article.
Analysts are catching up. This morning, economists at BofA wrote: “The most reasonable interpretation of the data flow seems to be that the neutral rate has increased a lot more than previously thought, and policy might not be restrictive at all.”
...
In normal times, the 30-year mortgage rate is typically 175 to 200 bp above the 10-year yield. Here is a graph of the relationship between 30-year mortgage rates and the 10-year yield since 1971.
The red dots are the for the period Jan 2022 until today. This shows that the spread increased with the inverted yield curve.


