 RSS Feed
 by Calculated Risk on 2/25/2025 01:11:00 PM
Tuesday, February 25, 2025
FDIC: Number of Problem Banks Decreased in Q4 2024
The FDIC released the Quarterly Banking Profile for Q4 2024:
Full-Year ROA and Net Income Increased in 2024
The banking industry reported full-year net income of $268.2 billion, up $14.1 billion (5.6 percent) from 2023. The aggregate return-on-assets ratio (ROA) increased 3 basis points to 1.12 percent. The increase primarily occurred due to one-time events in 2023 and 2024 that led to lower noninterest expense (down $8.5 billion, or 1.4 percent), higher noninterest income (up $6.0 billion, or 2.0 percent), and lower realized securities losses (down $5.3 billion, or 46.3 percent) in 2024. The full-year net interest margin decreased to 3.22 percent, down 8 basis points from 2023.
...
Asset Quality Metrics Remained Generally Favorable, Though Weakness in Certain Portfolios Persisted
Past-due and nonaccrual (PDNA) loans, or loans 30 or more days past due or in nonaccrual status, increased 7 basis points from the prior quarter to 1.60 percent of total loans. The industry’s PDNA ratio remained below the pre-pandemic average of 1.94 percent. The PDNA ratio for non-owner occupied commercial real estate (CRE) loans declined 5 basis points to 2.02 percent but remained 129 basis points above the pre-pandemic average. Despite declining slightly in the fourth quarter, the PDNA rate for the non-owner occupied CRE portfolio remained elevated, largely driven by office loans at banks with more than $250 billion in assets. However, these banks tend to have lower concentrations of such loans in relation to total assets and capital than smaller institutions, mitigating the overall risk.
The industry’s net charge-off ratio increased 4 basis points from the prior quarter to 0.70 percent, 5 basis points higher than the year-earlier quarter and 22 basis points above the pre-pandemic average. The credit card net charge-off ratio was 4.57 percent in the fourth quarter, up 9 basis points quarter over quarter and 109 basis points above the pre-pandemic average.
emphasis added
 Click on graph for larger image.
From the FDIC:
The Number of Problem Banks Decreased in the Fourth QuarterThis graph from the FDIC shows the number of problem banks.
The number of banks on the FDIC’s “Problem Bank List” decreased from 68 to 66 in the fourth quarter. Problem banks represented 1.5 percent of total banks at year-end, which is within the normal range of 1 to 2 percent of all banks during non-crisis periods.
Newsletter: Case-Shiller: National House Price Index Up 3.9% year-over-year in December
by Calculated Risk on 2/25/2025 09:54:00 AM
Today, in the Calculated Risk Real Estate Newsletter: Case-Shiller: National House Price Index Up 3.9% year-over-year in December
Excerpt:
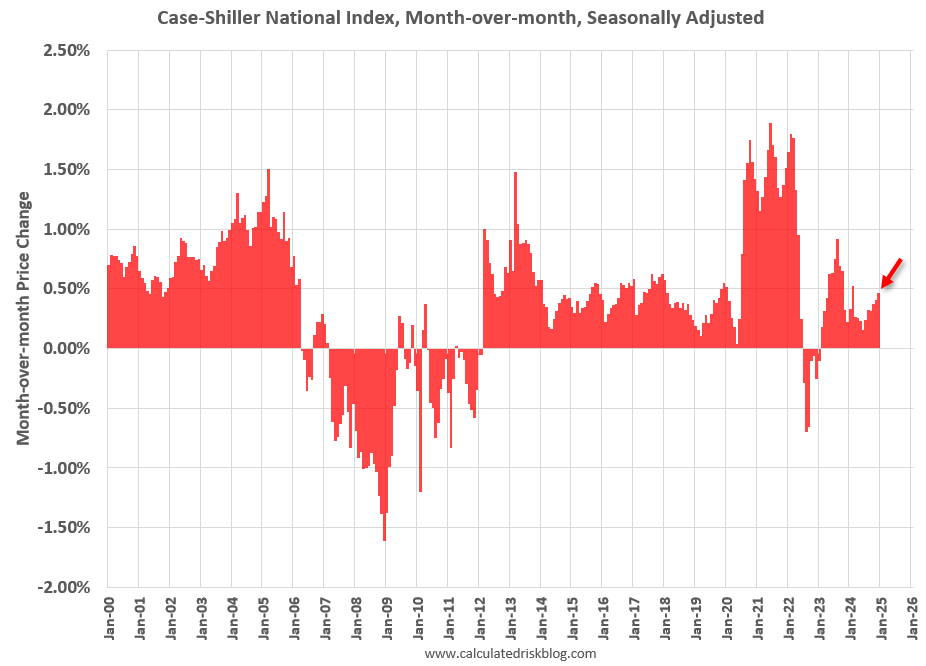
S&P/Case-Shiller released the monthly Home Price Indices for December ("December" is a 3-month average of October, November and December closing prices). December closing prices include some contracts signed in August, so there is a significant lag to this data. Here is a graph of the month-over-month (MoM) change in the Case-Shiller National Index Seasonally Adjusted (SA).There is much more in the article.
The MoM increase in the seasonally adjusted (SA) Case-Shiller National Index was at 0.46% (a 5.7% annual rate), This was the 23rd consecutive MoM increase in the seasonally adjusted index.
On a seasonally adjusted basis, prices increased month-to-month in 18 of the 20 Case-Shiller cities (prices declined in Washington, D.C. and Tampa seasonally adjusted). San Francisco has fallen 5.7% from the recent peak, Phoenix is down 1.2% from the peak, and Tampa down 1.2%.
Case-Shiller: National House Price Index Up 3.9% year-over-year in December
by Calculated Risk on 2/25/2025 09:00:00 AM
S&P/Case-Shiller released the monthly Home Price Indices for December ("December" is a 3-month average of October, November and December closing prices).
This release includes prices for 20 individual cities, two composite indices (for 10 cities and 20 cities) and the monthly National index.
From S&P S&P CoreLogic Case-Shiller Index Records 3.9% Annual Gain in December 2024
The S&P CoreLogic Case-Shiller U.S. National Home Price NSA Index, covering all nine U.S. census divisions, reported a 3.9% annual return for December, up from a 3.7% annual gain in the previous month. The 10-City Composite saw an annual increase of 5.1%, up from a 5% annual increase in the previous month. The 20-City Composite posted a year-over-year increase of 4.5%, up from a 4.3% increase in the previous month. New York again reported the highest annual gain among the 20 cities with a 7.2% increase in December, followed by Chicago and Boston with annual increases of 6.6% and 6.3%, respectively. Tampa posted the lowest return, falling 1.1%.
...
The pre-seasonally adjusted U.S. National and 20-City Composite Indices’ upward trends continued to reverse in December, with both posting a -0.1% drop. The 10-City Composite’s monthly return dropped 0.04%.
After seasonal adjustment, the U.S. National, 20-City, and 10-City Composite Indices all posted a month-over-month increase of 0.5%.
“It has been five years since the Covid-19 outbreak took hold of the global economy, sparking unprecedented volatility, massive fiscal and monetary stimulus, and a housing market that responded to national migratory changes in how we work and where we live,” says Brian D. Luke, CFA, Head of Commodities, Real & Digital Assets at S&P Dow Jones Indices. “National home prices have risen by 8.8% annually since 2020, led by markets in Florida, North Carolina, Southern California, and Arizona. While our National Index continues to trend above inflation, we are a few years removed from peak home price appreciation of 18.9% observed in 2021 and are seeing below-trend growth over the history of the index.
“Home prices stalled during the second half of the year with markets in the West dropping the fastest. San Francisco, the worst performing market since 2020, dropped 4.5% during the last six months of the year, followed by Seattle with a 3.0% decline. San Francisco is now 11.0% lower than its post-pandemic peak reached in May 2022. Previous strongholds like San Diego and Tampa experienced declines of 2.9% and 2.7%, respectively, during the second half of the year. After accounting for seasonal adjustments, our National Index pushed forward to achieve a 19th consecutive all-time high,” Luke continued. “The longest such streak occurred for over 12-years, notching 153 consecutive all-time highs from July 1993 to March 2006.
“The Northeast continues to lead all regions with above-trend growth, led by New York for the eighth consecutive time. Boston reached an all-time high, the only market to do so for the period ended December 2024."
emphasis added
 Click on graph for larger image.
 The first graph shows the nominal seasonally adjusted Composite 10, Composite 20 and National indices (the Composite 20 was started in January 2000).
The Composite 10 index was up 0.5% in December (SA). The Composite 20 index was up 0.5% (SA) in December.
The National index was up 0.5% (SA) in December.
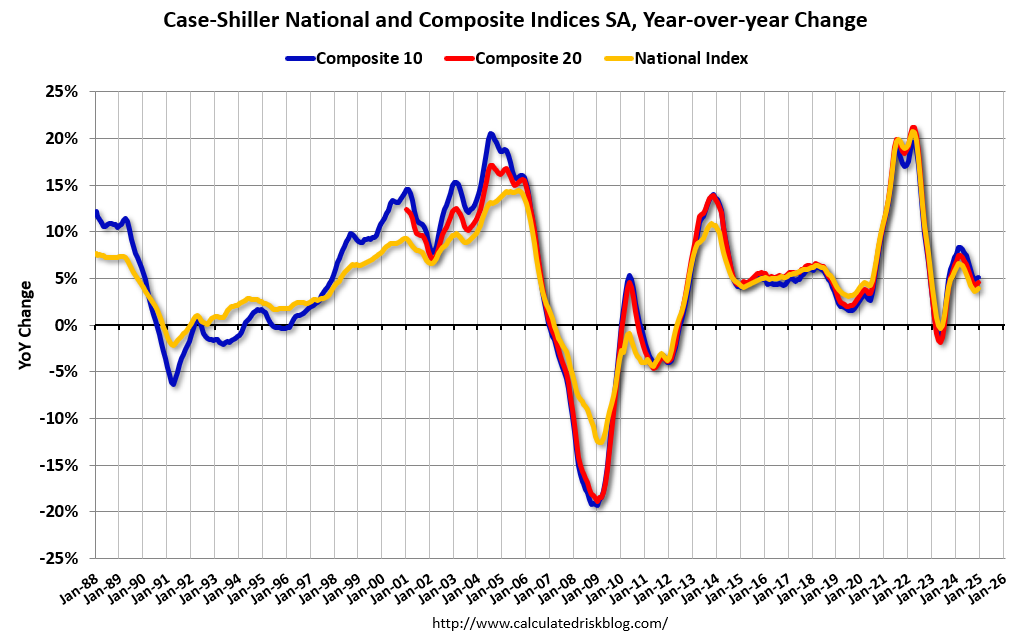 The second graph shows the year-over-year change in all three indices.
The Composite 10 NSA was up 5.1% year-over-year. The Composite 20 NSA was up 4.5% year-over-year.
The National index NSA was up 3.9% year-over-year.
Annual price changes were close to expectations. I'll have more later.
Monday, February 24, 2025
Tuesday: Case-Shiller House Prices, Richmond Fed Mfg
by Calculated Risk on 2/24/2025 07:06:00 PM
 From Matthew Graham at Mortgage News Daily: Mortgage Rates Start New Week at 2 Month Lows
Mortgage rates were already in line with the lowest levels since December 18th by last Thursday. They dropped to the best levels since December 12th a day later. end of last week.Tuesday:
...
The bond market (which underlies and dictates interest rate movement) was very calm today after early gains. Investors are waiting to see Friday's PCE inflation data before making any big moves in either direction ... [30 year fixed 6.87%]
emphasis added
• At 9:00 AM ET, FHFA House Price Index for December 2024. This was originally a GSE only repeat sales, however there is also an expanded index.
• At 9:00 AM, S&P/Case-Shiller House Price Index for December. The consensus is for a 4.5% year-over-year increase in the Comp 20 index for December, up from 4.3% in November.
• At 10:00 AM, Richmond Fed Survey of Manufacturing Activity for February.
February Vehicle Forecast: Sales Increase to 15.9 million SAAR, Up 1.5% YoY
by Calculated Risk on 2/24/2025 12:56:00 PM
From WardsAuto: February U.S. Light-Vehicle Sales Maintain Growth; Inventory Resumes Gains (pay content). Brief excerpt:
Sales are recording solid gains, but production slowdowns capping dealer stock in a growth market – a market that ostensibly still is climbing out of the trough caused by the pandemic and supply-chain issues - suggest the industry overall wants to maintain profit margins but also has a high level of uncertainty about 2025 and does not want to be in a position of having to make sudden, bigger cuts if the market weakens at some point this year.
emphasis added
 Click on graph for larger image.
This graph shows actual sales from the BEA (Blue), and Wards forecast for February (Red).
On a seasonally adjusted annual rate basis, the Wards forecast of 15.9 million SAAR, would be up 1.9% from last month, and up 1.5% from a year ago.
The Normal Seasonal Change for Median House Prices
by Calculated Risk on 2/24/2025 10:51:00 AM
Earlier, in the CalculatedRisk Real Estate Newsletter on January existing home sales, NAR: Existing-Home Sales Decreased to 4.08 million SAAR in January, I mentioned that the median price typically bottoms seasonally in January (contracts signed mostly in November and December) and peaks in June (April and May contracts).
Below is a table of the seasonal changes from January to June (all median prices Not Seasonally Adjusted, NSA).
Note: In 2020, prices increased late into the year and peaked in October, but prices peaked in June for all the other years.
| Change in Median House Price from January to June | ||||||
|---|---|---|---|---|---|---|
| 2018 | 2019 | 2020 | 2021 | 2022 | 2023 | |
| January to June | 13.7% | 14.4% | 10.6% | 20.8% | 16.8% | 12.8% |
The NAR reported the median price was $396,900 in January 2025, down 7.0% from $426,900 in June 2024.
We should expect the median price to increase seasonally over the next 5 months, but only slightly in February.
Housing Feb 24th Weekly Update: Inventory Up 0.3% Week-over-week, Up 28.7% Year-over-year
by Calculated Risk on 2/24/2025 08:11:00 AM
Altos reports that active single-family inventory was up 0.3% week-over-week.
Inventory always declines seasonally in the Winter and usually bottoms in January or February. Inventory is now up 2.5% from the bottom six weeks ago in January.
The first graph shows the seasonal pattern for active single-family inventory since 2015.
 Click on graph for larger image.
The red line is for 2025. The black line is for 2019.
Inventory was up 28.7% compared to the same week in 2024 (last week it was up 29.2%), and down 21.9% compared to the same week in 2019 (last week it was down 22.1%).
Back in June 2023, inventory was down almost 54% compared to 2019, so the gap to more normal inventory levels has closed significantly!
 This second inventory graph is courtesy of Altos Research.
As of Feb 21st, inventory was at 640 thousand (7-day average), compared to 638 thousand the prior week.
Mike Simonsen discusses this data regularly on Youtube
Sunday, February 23, 2025
Sunday Night Futures
by Calculated Risk on 2/23/2025 06:17:00 PM
Weekend:
• Schedule for Week of February 23, 2025
• Housing Starts and Recessions
Monday:
• At 8:30 AM ET, Chicago Fed National Activity Index for January. This is a composite index of other data.
• At 10:30 AM, Dallas Fed Survey of Manufacturing Activity for February.
From CNBC: Pre-Market Data and Bloomberg futures S&P 500 are up 13 and DOW futures are up 67 (fair value).
Oil prices were down over the last week with WTI futures at $70.40 per barrel and Brent at $74.43 per barrel. A year ago, WTI was at $78, and Brent was at $84 - so WTI oil prices are down about 10% year-over-year.
Here is a graph from Gasbuddy.com for nationwide gasoline prices. Nationally prices are at $3.11 per gallon. A year ago, prices were at $3.26 per gallon, so gasoline prices are down $0.15 year-over-year.
Housing Starts and Recessions
by Calculated Risk on 2/23/2025 11:04:00 AM
This morning, Carl Quintanilla posted a graph on Bluesky from BESPOKE suggesting the US is heading towards a recession.
 Quintanilla quoted BESPOKE:
“On a 12-month average basis, .. Housing Starts have completely rolled over from their peak ..Housing is the basis of one of my favorite models for business cycle forecasting. And policy changes will clearly have a negative impact on homebuilders. Early in February, I expressed my "increasing concern" about the negative economic impact of "executive / fiscal policy errors", however, I concluded that post by noting that I was not currently on recession watch.
“.. Recessions have always followed a rollover in Housing Starts, and the only question is timing.”
Here is an update to a graph that uses new home sales, single family housing starts and residential investment. (I prefer single family starts to total starts). The purpose of this graph is to show that these three indicators generally reach peaks and troughs together. Note that Residential Investment is quarterly and single-family starts and new home sales are monthly.
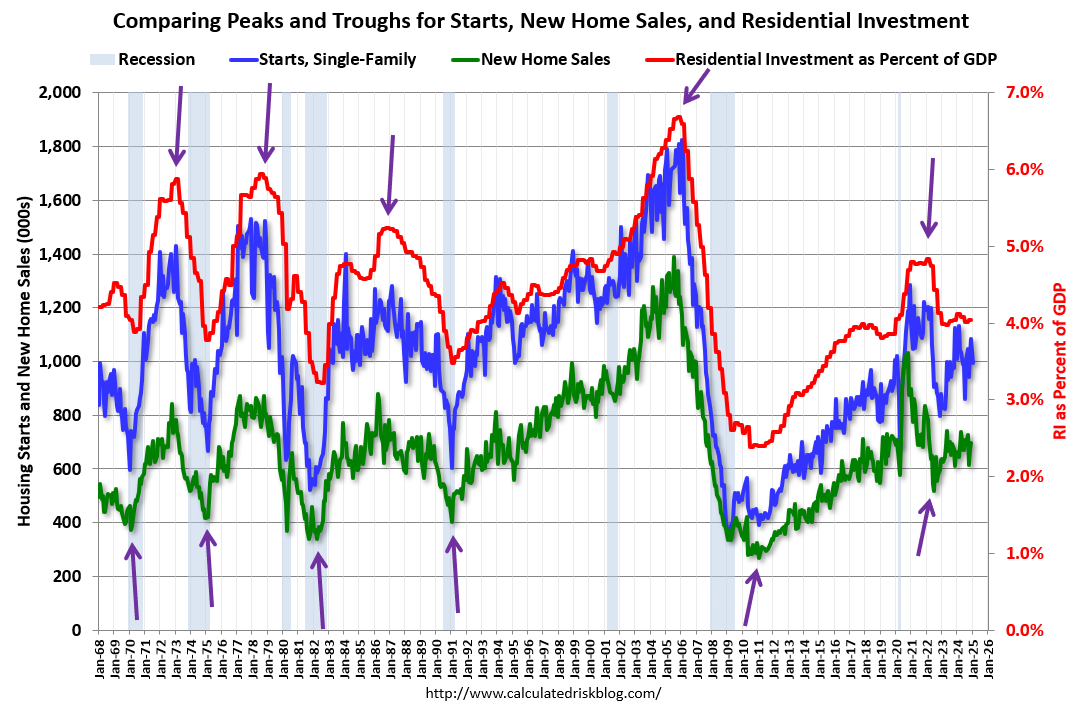 The arrows point to some of the earlier peaks and troughs for these three measures - and the most recent peak.
New home sales peaked in 2020 as pandemic buying soared. Then new home sales and single-family starts turned down in 2021, but that was partly due to the huge surge in sales during the pandemic. In 2022, both new home sales and single-family starts turned down in response to higher mortgage rates.
This decline in residential investment would typically have suggested that a recession was coming, however I looked past the pandemic distortions and correctly predicted no recession! The low level of existing home inventory led me to predict that new home sales would pick up - and that happened. We can't be a slave to any model.
 This second graph shows the YoY change in New Home Sales from the Census Bureau. Currently new home sales (based on 3-month average) are down 1% year-over-year!
Usually when the YoY change in New Home Sales falls about 20%, a recession will follow. An exception for this data series was the mid '60s when the Vietnam buildup kept the economy out of recession. Another exception was in late 2021 - we saw a significant YoY decline in new home sales related to the pandemic and the surge in new home sales in the second half of 2020. I ignored that downturn as a pandemic distortion. Also note that the sharp decline in 2010 was related to the housing tax credit policy in 2009 - and was just a continuation of the housing bust.
The YoY change in new home sales in late 2022 and early 2023 suggested a possible recession. But as I noted earlier, I was able to look past the pandemic distortion and was able to predict a pickup in new home sales due to the low level of existing home inventory and because homebuilders could offer mortgage incentives that would somewhat offset the sharp increase in mortgage rates.

Another indicator I like to use is heavy truck sales. This graph shows heavy truck sales since 1967 using data from the BEA. The dashed line is the January 2025 seasonally adjusted annual sales rate (SAAR). Note: "Heavy trucks - trucks more than 14,000 pounds gross vehicle weight."
Heavy truck sales were at 534 thousand SAAR in January, up from 454 thousand in December, and up 4.6% from 510 thousand SAAR in January 2025.
Usually, heavy truck sales decline sharply prior to a recession, however sales were strong in January.
I share BESPOKE's concern about the potential negative impact of policy on housing starts, but I think it is way too early to start predicting a recession.
Saturday, February 22, 2025
Real Estate Newsletter Articles this Week: Mortgage Delinquencies Increase, Foreclosures Remain Low
by Calculated Risk on 2/22/2025 02:11:00 PM
At the Calculated Risk Real Estate Newsletter this week:
 Click on graph for larger image.
• NAR: Existing-Home Sales Decreased to 4.08 million SAAR in January
• Housing Starts Decreased to 1.366 million Annual Rate in January
• The "Neutral" Rate and Implications for 30-year Mortgage Rates
• California Home Sales Down 1.9% YoY in January; 4th Look at Local Housing Markets
• Lawler: Early Read on Existing Home Sales in January
This is usually published 4 to 6 times a week and provides more in-depth analysis of the housing market.


