 RSS Feed
 by Calculated Risk on 2/27/2025 10:00:00 AM
Thursday, February 27, 2025
NAR: Pending Home Sales Decrease 4.6% in January to an "All-time low"
From the NAR: Pending Home Sales Waned 4.6% in January
Pending home sales pulled back 4.6% in January according to the National Association of REALTORS®. The Midwest, South and West experienced month-over-month losses in transactions – with the most significant drop in the South – while the Northeast saw a modest gain. Year-over-year, contract signings lowered in all four U.S. regions, with the South seeing the greatest falloff.Note: Contract signings usually lead sales by about 45 to 60 days, so this would usually be for closed sales in February and March.
The Pending Home Sales Index (PHSI)* – a forward-looking indicator of home sales based on contract signings – fell 4.6% to 70.6 in January, an all-time low. (Last year's cyclical low point in July 2024 was revised from 70.2 to 71.2.) Year-over-year, pending transactions declined 5.2%. An index of 100 is equal to the level of contract activity in 2001.
"It is unclear if the coldest January in 25 years contributed to fewer buyers in the market, and if so, expect greater sales activity in upcoming months," said NAR Chief Economist Lawrence Yun. "However, it's evident that elevated home prices and higher mortgage rates strained affordability."
...
The Northeast PHSI rose 0.3% from last month to 63.4, down 0.5% from January 2024. The Midwest index contracted 2.0% to 72.8 in January, down 2.7% from the previous year.
The South PHSI plunged 9.2% to 81.0 in January, down 8.8% from a year ago. The West in
emphasis added
Q4 GDP Growth Unrevised at 2.3% Annual Rate
by Calculated Risk on 2/27/2025 08:36:00 AM
From the BEA: Gross Domestic Product, 4th Quarter and Year 2024 (Second Estimate)
Real gross domestic product (GDP) increased at an annual rate of 2.3 percent in the fourth quarter of 2024 (October, November, and December), according to the second estimate released by the U.S. Bureau of Economic Analysis. In the third quarter, real GDP increased 3.1 percent.Here is a Comparison of Second and Advance Estimates. PCE growth was unrevised at 4.2%. Residential investment was revised up from 5.3% to 5.4%.
The increase in real GDP in the fourth quarter primarily reflected increases in consumer spending and government spending that were partly offset by a decrease in investment. Imports, which are a subtraction in the calculation of GDP, decreased. ... Real GDP was revised up by less than 0.1 percentage point from the advance estimate released last month, primarily reflecting upward revisions to government spending and exports that were partly offset by downward revisions to consumer spending and investment.
emphasis added
Weekly Initial Unemployment Claims Increase to 242,000
by Calculated Risk on 2/27/2025 08:30:00 AM
The DOL reported:
In the week ending February 22, the advance figure for seasonally adjusted initial claims was 242,000, an increase of 22,000 from the previous week's revised level. The previous week's level was revised up by 1,000 from 219,000 to 220,000. The 4-week moving average was 224,000, an increase of 8,500 from the previous week's revised average. The previous week's average was revised up by 250 from 215,250 to 215,500.The following graph shows the 4-week moving average of weekly claims since 1971.
emphasis added
 Click on graph for larger image.
The dashed line on the graph is the current 4-week average. The four-week average of weekly unemployment claims increased to 224,000.
The previous week was revised up.
Weekly claims were well above the consensus forecast.
Wednesday, February 26, 2025
Thursday: GDP, Unemployment Claims, Durable Goods, Pending Home Sales
by Calculated Risk on 2/26/2025 07:45:00 PM
 Note: Mortgage rates are from MortgageNewsDaily.com and are for top tier scenarios.
Thursday:
• At 8:30 AM ET, The initial weekly unemployment claims report will be released. The consensus is for an increase to 225 thousand from 219 thousand last week.
• At 8:30 AM, Gross Domestic Product, 4th Quarter and Year 2024 (Second Estimate) The consensus is that real GDP increased 2.3% annualized in Q4, unchanged from the advance estimate of 2.3%.
• At 8:30 AM, Durable Goods Orders for January from the Census Bureau. The consensus is for a 1.8% increase in durable goods orders.
• At 10:00 AM, Pending Home Sales Index for January. The consensus is for a 1.2% decrease in the index.
• At 11:00 AM, the Kansas City Fed manufacturing survey for February.
Lawler: Treasury Secretary Wrongly Says Fed Has Been “Big Seller” of Treasuries
by Calculated Risk on 2/26/2025 04:57:00 PM
From housing economist Tom Lawler: Treasury Secretary Wrongly Says Fed Has Been “Big Seller” of Treasuries
In an interview last week, Treasury Secretary Bessent said that any plans by the Treasury to extend the maturity were “a long ways off.” One of the reasons cited by Secretary Bessent was the Federal Reserve’s current balance sheet runoff policy. Here is a quote from Bessent.
“The Fed’s balance sheet runoff increases the supply of Treasuries. It’s easier for me to extend duration when I’m not competing with another big seller.”This statement appears to reflect Bessent’s complete misunderstanding of how the Federal Reserve has implemented its balance sheet runoff. Rather than being a “big seller” of intermediate and long term Treasury securities, the Fed has actually been a pretty big buyer of intermediate and long term Treasury securities even as it has lowered the overall size of its balance sheet.
The Federal Reserve owns a sizable amount of Treasuries, including a significant amount that matures in a short period of time. What the Fed has been doing is essentially targeting a desired decline in its overall balance sheet, and reinvesting a portion of the sizable amount of Treasuries maturing (and MBS principal repayments) into Treasury bills (short maturities) and Treasury notes and bonds (long maturities), TIPS (long maturities), and a de minimus amount of Floating Rate Notes in order to hit a targeted total balance. The replacement of some of the maturing notes and bonds (which by definition have very short maturities) into new longer-maturity notes and bonds extends the maturity of Federal Reserve Treasury note and bond holdings.
Here is a table showing the Fed’s System Open Market Account’s (SOMA) purchases, sales, and maturities (from the Fed’s quarterly financial statement)
 As this table shows, even during the period where the Fed has reduced its balance sheet (a period some call “quantitative tightening,” though that is something of a misnomer), the Fed has been a significant net buyer of Treasury notes and bonds – and overall sales have been very small.
At the end of 2024, SOMA held $184.8 BILLION of Treasury notes and bonds (ex TIPS) that were not on its balance sheet at the end of 2023, with a weighted average maturity at the end of 2014 of 8.11 years, as well as 3.49 BILLION of TIPS not on its balance sheet a year earlier with a weighted average maturity of 10.52 years.
The Treasury’s purchases of Treasury notes and bond has continued this year. Below is a table showing SOMA’s purchases of Treasury notes and bonds at this year’s Treasury note and bond auctions.
 The 3, 10, and 30 year SOMA purchases were especially noticeable, in that (1) SOMA owns a sizable 21.55% of the latest issued 3, 10, and 30 Treasury year securities, and (2) the sizable Fed purchases at these auctions was only about a week before Bessent’s incorrect comment that the Fed has been a “big seller” of Treasuries.
On January 31, 2025 the weighted average maturity of marketable Treasury securities outstanding was 5.88 years, while the weighted average maturity of SOMA Treasury securities holdings on February 19, 2025 was a staggering 8.97 years.
In terms of why I think the term “quantitative tightening” [is a misnomer] to describe the last few years, it’s useful to remember what quantitative easing entailed: not just expanding the size of the Fed’s balance sheet, but also purchasing huge amounts of long-term Treasuries (and agency MBS) that were in large part designed to lower long-term interest rates (including term premiums). A quantitative tightening designed to offset part of the quantitative easing would have involved selling long-term Treasuries (and MBS) in order to allow for term premiums to return to a more normal level. That, of course, is NOT what the Fed has done. Indeed, Fed actions since the so-called “QT” period began has actually resulted in a slight decline in the weighted average maturity of marketable Treasuries held by the public.
As such, while the Federal Reserve has in fact significantly reduced the size of its balance sheet, its overall strategy still seems to be that of keeping longer-term interest rates lower than they would other be. That, of course, is why I would not characterize the latest period of Federal Reserve balance sheet shrinkage as quantitative tightening, and it is most certainly the case that this recent period has in any way reversed the previous quantitative easing.
 Note The Fed currently only owns about 3% of Treasury Bills outstanding but owns about 30% of Treasury notes and bonds (ex TIPS) with a maturity greater than 10 years.
Next Up: When the Fed decides to stop reducing its balance sheet, will the Fed’s purchases of longer-term Treasuries decline? (Hint: Read the latest FOMC minutes).
Newsletter: New Home Sales Decrease to 657,000 Annual Rate in January
by Calculated Risk on 2/26/2025 10:40:00 AM
Today, in the Calculated Risk Real Estate Newsletter: New Home Sales Decrease to 657,000 Annual Rate in January
Brief excerpt:
The Census Bureau reported New Home Sales in January were at a seasonally adjusted annual rate (SAAR) of 657 thousand. The previous three months were revised up.There is much more in the article.
...
The next graph shows new home sales for 2024 and 2025 by month (Seasonally Adjusted Annual Rate). Sales in January 2025 were down 1.1% from January 2024.
New home sales, seasonally adjusted, have increased year-over-year in 19 of the last 22 months. This is essentially the opposite of what happened with existing home sales that had been down year-over-year every month for 3+ years (existing home sales have been up year-over-year for the last 4 months).

New Home Sales Decrease to 657,000 Annual Rate in January
by Calculated Risk on 2/26/2025 10:00:00 AM
The Census Bureau reports New Home Sales in January were at a seasonally adjusted annual rate (SAAR) of 657 thousand.
The previous three months were revised up.
Sales of new single-family houses in January 2025 were at a seasonally adjusted annual rate of 657,000, according to estimates released jointly today by the U.S. Census Bureau and the Department of Housing and Urban Development. This is 10.5 percent below the revised December rate of 734,000 and is 1.1 percent below the January 2024 estimate of 664,000.
emphasis added
 Click on graph for larger image.
The first graph shows New Home Sales vs. recessions since 1963. The dashed line is the current sales rate.
New home sales were slightly below pre-pandemic levels.
The second graph shows New Home Months of Supply.
 The months of supply increased in January to 9.0 months from 8.0 months in December.
 The all-time record high was 12.2 months of supply in January 2009. The all-time record low was 3.3 months in August 2020.
This is well above the top of the normal range (about 4 to 6 months of supply is normal).
"The seasonally-adjusted estimate of new houses for sale at the end of January was 495,000. This represents a supply of 9.0 months at the current sales rate."Sales were below expectations of 678 thousand SAAR, however sales for the three previous months were revised up. I'll have more later today.
MBA: Mortgage Applications Decrease in Latest MBA Weekly Survey
by Calculated Risk on 2/26/2025 07:00:00 AM
From the MBA: Mortgage Applications Decrease in Latest MBA Weekly Survey
Mortgage applications decreased 1.2 percent from one week earlier, according to data from the Mortgage Bankers Association’s (MBA) Weekly Mortgage Applications Survey for the week ending February 21, 2025.
The Market Composite Index, a measure of mortgage loan application volume, decreased 1.2 percent on a seasonally adjusted basis from one week earlier. On an unadjusted basis, the Index decreased 4 percent compared with the previous week. The Refinance Index decreased 4 percent from the previous week and was 45 percent higher than the same week one year ago. The seasonally adjusted Purchase Index increased 0 percent from one week earlier. The unadjusted Purchase Index decreased 5 percent compared with the previous week and was 3 percent higher than the same week one year ago.
“Treasury yields moved lower on softer consumer spending data as consumers are feeling somewhat less upbeat about the economy and job market. This pushed mortgage rates lower, with the 30-year fixed rate decreasing to 6.88 percent, the lowest rate since mid-December,” said Joel Kan, MBA’s Vice President and Deputy Chief Economist. “Applications were about one percent lower for the week, which included the President’s Day holiday, as purchase applications stayed flat from a week ago while refinance applications saw a small decline. Purchase applications were up 3 percent from the same week last year. Increasing for-sale inventory in some markets has provided prospective buyers more options as we approach the spring homebuying season.”
Added Kan, “Although overall refinance application activity remained fairly weak, FHA refinance applications saw an 8 percent increase over the week. Compared to last year, overall refinance applications were up 45 percent.
...
The average contract interest rate for 30-year fixed-rate mortgages with conforming loan balances ($766,550 or less) decreased to 6.88 percent from 6.93 percent, with points decreasing to 0.61 from 0.66 (including the origination fee) for 80 percent loan-to-value ratio (LTV) loans.
emphasis added
 Click on graph for larger image.
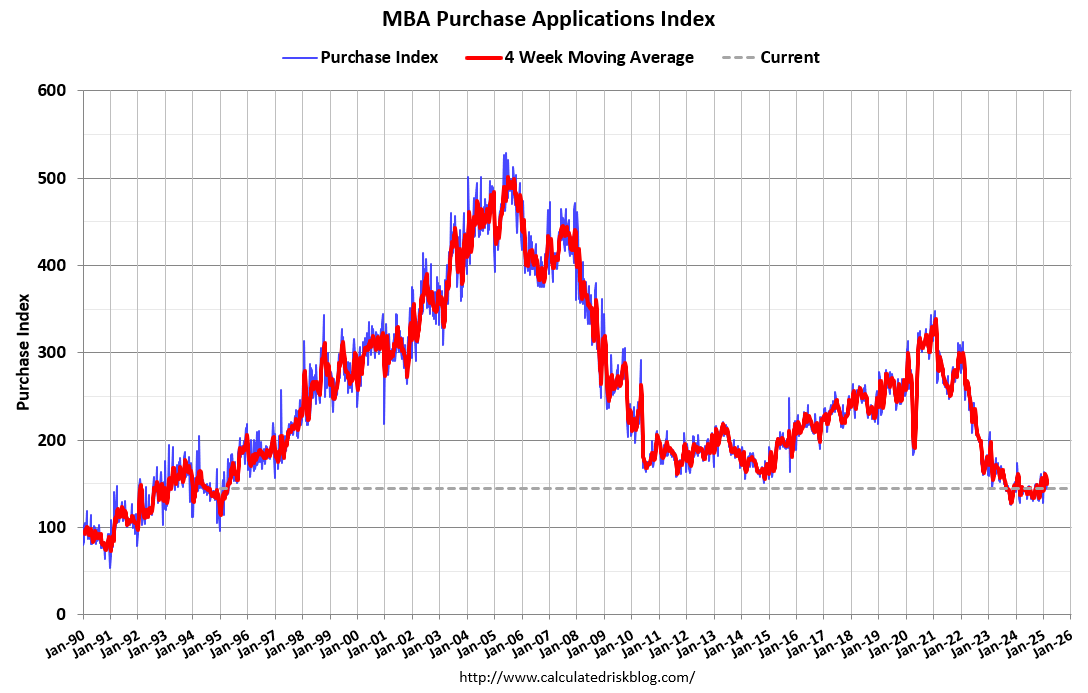
The first graph shows the MBA mortgage purchase index.
According to the MBA, purchase activity is up 3% year-over-year unadjusted.
Red is a four-week average (blue is weekly).
Purchase application activity is up about 15% from the lows in late October 2023 and is now 4% below the lowest levels during the housing bust.

The second graph shows the refinance index since 1990.
The refinance index remains very low.
Tuesday, February 25, 2025
Wednesday: New Home Sales
by Calculated Risk on 2/25/2025 07:41:00 PM
 Note: Mortgage rates are from MortgageNewsDaily.com and are for top tier scenarios.
Wednesday:
• At 7:00 AM ET, The Mortgage Bankers Association (MBA) will release the mortgage purchase applications index.
• At 10:00 AM, New Home Sales for January from the Census Bureau. The consensus is that new home sales decreased to 678 thousand SAAR, down from 698 thousand in December.
A few comments on the Seasonal Pattern for House Prices
by Calculated Risk on 2/25/2025 04:16:00 PM
A few key points:
1) There is a clear seasonal pattern for house prices.
2) The surge in distressed sales during the housing bust distorted the seasonal pattern. This was because distressed sales (at lower price points) happened at a steady rate all year, while regular sales followed the normal seasonal pattern. This made for larger swings in the seasonal factor during the housing bust.
3) The seasonal swings have increased recently without a surge in distressed sales.
 Click on graph for larger image.
This graph shows the month-to-month change in the NSA Case-Shiller National index since 1987 (through December 2024). The seasonal pattern was smaller back in the '90s and early '00s and increased once the bubble burst.
The seasonal swings declined following the bust, however the pandemic price surge changed the month-over-month pattern.
 The second graph shows the seasonal factors for the Case-Shiller National index since 1987. The factors started to change near the peak of the bubble, and really increased during the bust since normal sales followed the regular seasonal pattern - and distressed sales happened all year.
The swings in the seasonal factors were decreasing following the bust but have increased again recently - this time without a surge in distressed sales.
 Click on graph for larger image.
This graph shows the month-to-month change in the NSA Case-Shiller National index since 1987 (through December 2024). The seasonal pattern was smaller back in the '90s and early '00s and increased once the bubble burst.
The seasonal swings declined following the bust, however the pandemic price surge changed the month-over-month pattern.
 The second graph shows the seasonal factors for the Case-Shiller National index since 1987. The factors started to change near the peak of the bubble, and really increased during the bust since normal sales followed the regular seasonal pattern - and distressed sales happened all year.
 The swings in the seasonal factors were decreasing following the bust but have increased again recently - this time without a surge in distressed sales.


