by Calculated Risk on 2/03/2021 08:18:00 AM
Wednesday, February 03, 2021
ADP: Private Employment increased 174,000 in January
Private sector employment increased by 174,000 jobs from December to January according to the January according to the December ADP National Employment Report®. ... The report, which is derived from ADP’s actual payroll data, measures the change in total nonfarm private employment each month on a seasonally-adjusted basis.This was well above the consensus forecast of 45,000 for this report.
“The labor market continues its slow recovery amid COVID-19 headwinds,” said Ahu Yildirmaz, vice president and co-head of the ADP Research Institute. “Although job losses were previously concentrated among small and midsized businesses, we are now seeing signs of the prolonged impact of the pandemic on large companies as well.”
emphasis added
The BLS report will be released Friday, and the consensus is for 50 thousand non-farm payroll jobs added in January. Of course the ADP report has not been very useful in predicting the BLS report.
MBA: Mortgage Applications Increase in Latest Weekly Survey
by Calculated Risk on 2/03/2021 07:00:00 AM
From the MBA: Mortgage Applications Increase in Latest MBA Weekly Survey
Mortgage applications increased 8.1 percent from one week earlier, according to data from the Mortgage Bankers Association’s (MBA) Weekly Mortgage Applications Survey for the week ending January 29, 2021.
... The Refinance Index increased 11 percent from the previous week and was 59 percent higher than the same week one year ago. The seasonally adjusted Purchase Index increased 0.1 percent from one week earlier. The unadjusted Purchase Index increased 8 percent compared with the previous week and was 16 percent higher than the same week one year ago.
“After increasing for three consecutive weeks, the 30-year fixed mortgage rate dropped 3 basis points to 2.92 percent. The one-week reversal in the recent upswing in rates drove an increase in both conventional and government refinance activity, as borrowers continue to lock in these historically low rates. MBA’s refinance index hit its highest level since March 2020 and jumped 60 percent year-overyear,” said Joel Kan, MBA’s Associate Vice President of Economic and Industry Forecasting. “Purchase activity was unchanged last week, with a 1 percent increase in conventional applications offset by a 3 percent decline in government applications. Average purchase loan amounts in early 2021 continue to rise across all loan types, driven by a strong pace of home sales, tight housing inventory and high homeprice growth. Conventional, FHA and VA purchase loan sizes all set new survey records last week.”
...
The average contract interest rate for 30-year fixed-rate mortgages with conforming loan balances ($510,400 or less) decreased to 2.92 percent from 2.95 percent, with points remaining unchanged at 0.32 (including the origination fee) for 80 percent loan-to-value ratio (LTV) loans.
emphasis added
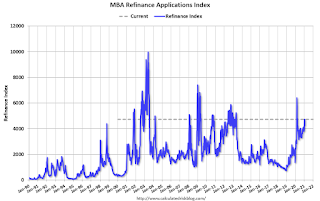 Click on graph for larger image.
The first graph shows the refinance index since 1990.
The refinance index has been volatile recently depending on rates.
With near record low rates, the index remains up significantly from last year.
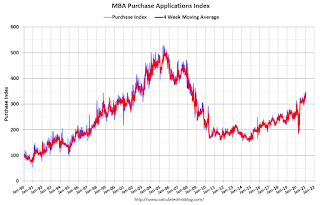 The second graph shows the MBA mortgage purchase index
According to the MBA, purchase activity is up 16% year-over-year unadjusted.
Note: Red is a four-week average (blue is weekly).
Tuesday, February 02, 2021
Wednesday: ADP Employment, ISM Services Index
by Calculated Risk on 2/02/2021 09:12:00 PM
Wednesday:
• At 7:00 AM ET, The Mortgage Bankers Association (MBA) will release the results for the mortgage purchase applications index.
• At 8:15 AM, The ADP Employment Report for January. This report is for private payrolls only (no government). The consensus is for 45,000 payroll jobs added in January, up from 123,000 lost in December.
• At 10:00 AM, the ISM Services Index for January.
February 2 COVID-19 Test Results and Vaccinations
by Calculated Risk on 2/02/2021 06:46:00 PM
Note: Bloomberg has great data on vaccinations.
"In the U.S., more Americans have now received at least one dose than have tested positive for the virus since the pandemic began. So far, 33.7 million doses have been given, according to a state-by-state tally. In the last week, an average of 1.32 million doses per day were administered."Also check out the graphs at COVID-19 Vaccine Projections The site has several interactive graphs related to US COVID vaccinations including a breakdown of how many have had one shot, and how many have had both shots.
The US is now averaging close to 2 million tests per day. Based on the experience of other countries, for adequate test-and-trace (and isolation) to reduce infections, the percent positive needs to be under 5% (probably close to 1%), so the US has far too many daily cases - and percent positive - to do effective test-and-trace.
There were 1,375,084 test results reported over the last 24 hours.
There were 115,619 positive tests.
Over 5,000 US deaths have been reported in February. See the graph on US Daily Deaths here.
This data is from the COVID Tracking Project.
And check out COVID Act Now to see how each state is doing. (updated link to new site)
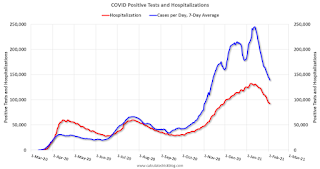 Click on graph for larger image.
This graph shows the 7 day average of positive tests reported and daily hospitalizations.
The percent positive over the last 24 hours was 8.4%. The percent positive is calculated by dividing positive results by total tests (including pending).
It seems likely cases and hospitalizations have peaked, but are declining from a very high level.
U.S. Courts: Bankruptcy Filings Decline 29.7% in 2020
by Calculated Risk on 2/02/2021 01:52:00 PM
From the U.S. Courts: Annual Bankruptcy Filings Fall 29.7 Percent
Bankruptcy filings fell sharply for the 12-month period ending Dec. 31, 2020, despite a significant surge in unemployment related to the coronavirus (COVID-19).
Annual bankruptcy filings in calendar year 2020 totaled 544,463, compared with 774,940 cases in 2019, according to statistics released by the Administrative Office of the U.S. Courts. That is a decrease of 29.7 percent.
Only one category saw an increase in filings. Chapter 11 reorganizations rose 19.2 percent, from 6,808 in 2019 to 8,113 in 2020. Of those, 7,561 involved business reorganizations.
The number of total filings was the lowest since 1986, when 530,438 bankruptcies were filed. Filings fell sharply in the early months of the pandemic, starting in March 2020, when many courts offered limited access to the public. In addition, bankruptcy filings can lag behind other economic indicators. Following the Great Recession, which began in 2007, new filings escalated until they peaked in 2010.
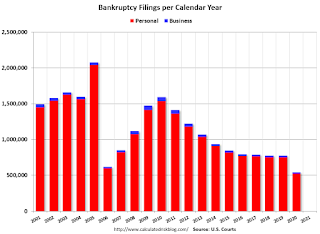 Click on graph for larger image.
This graph shows the business and non-business bankruptcy filings by calendar year since 2001.
The sharp decline in 2006 was due to the so-called "Bankruptcy Abuse Prevention and Consumer Protection Act of 2005". (a good example of Orwellian named legislation since this was more a "Lender Protection Act").
Due to the pandemic, bankruptcy filings fell sharply in 2020 to the lowest level since 1986. It is likely that bankruptcy filings will increase in 2021.
Update: Framing Lumber Prices Almost Double Year-over-year
by Calculated Risk on 2/02/2021 01:17:00 PM
Here is another monthly update on framing lumber prices.
This graph shows CME framing futures through Feb 2nd.

There is a seasonal pattern for lumber prices, and usually prices will increase in the Spring, and peak around May, and then bottom around October or November - although there is quite a bit of seasonal variability.
Clearly there is another surge in demand for lumber.
HVS: Q4 2020 Homeownership and Vacancy Rates
by Calculated Risk on 2/02/2021 10:19:00 AM
The Census Bureau released the Residential Vacancies and Homeownership report for Q4 2020.
It is likely the results of this survey were significantly distorted by the pandemic. See note from Census below.
This report is frequently mentioned by analysts and the media to track household formation, the homeownership rate, and the homeowner and rental vacancy rates. However, there are serious questions about the accuracy of this survey.
This survey might show the trend, but I wouldn't rely on the absolute numbers. The Census Bureau is investigating the differences between the HVS, ACS and decennial Census, and analysts probably shouldn't use the HVS to estimate the excess vacant supply or household formation, or rely on the homeownership rate, except as a guide to the trend.
"National vacancy rates in the fourth quarter 2020 were 6.5 percent for rental housing and 1.0 percent for homeowner housing. The rental vacancy rate of 6.5 percent was not statistically different from the rate in the fourth quarter 2019 (6.4 percent) and not statistically different from the rate in the third quarter 2020 (6.4 percent). The homeowner vacancy rate of 1.0 percent was 0.4 percentage points lower than the rate in the fourth quarter 2019 (1.4 percent) and not statistically different from the rate in the third quarter 2020 (0.9 percent).
The homeownership rate of 65.8 percent was 0.7 percentage points higher than the rate in the fourth quarter 2019 (65.1 percent) and 1.6 percentage points lower than the rate in the third quarter 2020 (67.4 percent)."
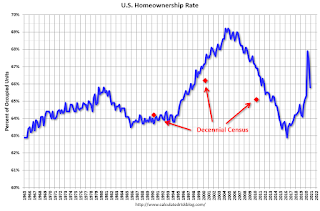 Click on graph for larger image.
The Red dots are the decennial Census homeownership rates for April 1st 1990, 2000 and 2010. The HVS homeownership rate decreased to 65.8% in Q4, from 67.4% in Q3.
I'd put more weight on the decennial Census numbers. The results in Q2 through Q4 of 2020 were distorted by the pandemic.
 The HVS homeowner vacancy increased to 1.0% from 0.9% in Q3.
 Once again - this probably shows the general trend, but I wouldn't rely on the absolute numbers.
From Census:
Due to the coronavirus pandemic (COVID-19), data collection operations for the CPS/HVS were affected during the fourth quarter of 2020, as in-person interviews were only allowed for portions of the sample in October (100 percent), November (98 percent), and December (84 percent). If the Field Representative was unable to get contact information on the sample unit, the unit was made a Type A noninterview (no one home, refusal, etc). We are unable to determine the extent to which this data collection change affected our estimates.
 The rental vacancy rate increased to 6.5% in Q4.
The quarterly HVS is the most timely survey on households, but there are many questions about the accuracy of this survey.
CoreLogic: House Prices up 9.2% Year-over-year in December
by Calculated Risk on 2/02/2021 08:00:00 AM
Notes: This CoreLogic House Price Index report is for December. The recent Case-Shiller index release was for November. The CoreLogic HPI is a three month weighted average and is not seasonally adjusted (NSA).
From CoreLogic: Onward and Upward: Annual US Home Price Appreciation in 2020 Outpaced 2019 Levels by 50%, CoreLogic Reports
CoreLogic® ... today released the CoreLogic Home Price Index (HPI™) and HPI Forecast™ for December 2020, providing a lookback at the state of the housing market and the pandemic’s impact on home price performance throughout 2020.
The housing market exceeded expectations in 2020, closing out the year with the highest annual home price gain since February 2014 in December at 9.2%. Despite a blip in April, home-purchase demand surged as record-low mortgage rates persuaded first-time homebuyers to enter the market. Meanwhile, the consequences of the pandemic were seen in the dwindling supply of homes — dropping, on average, 24% below 2019 levels — as homeowners delayed selling.
These factors translated to significant home price growth in 2020, surpassing the previous year’s levels with an average monthly year-over-year gain of 5.7%, compared with 3.8% in 2019. However, with the severe shortage of for-sale homes, we may see rising affordability concerns and some prospective buyers priced out of the market in 2021.
“At the start of the pandemic, many braced for a Great Recession-era collapse of the housing market,” said Frank Martell, president and CEO of CoreLogic. “However, market conditions leading into the crisis — namely low home supply, desire for more space and millennial demand — amplified the rapid acceleration of home prices.”
“Two record lows are fueling home price gains: for-sale inventory and mortgage rates,” said Dr. Frank Nothaft, chief economist at CoreLogic. “Prospective sellers with flexible timetables have opted to delay listing their home until the pandemic fades or they are vaccinated. We can expect more inventory to come available in the second half of the year, leading to slowing in price growth toward year-end.”
emphasis added
Monday, February 01, 2021
Mortgage Rates still near Record Lows
by Calculated Risk on 2/01/2021 09:12:00 PM
From Matthew Graham at Mortgage News Daily: Mortgage Rates Hold Steady to Start New Week
The average mortgage lender offered rates that were at least as good as Friday's with purchases still seeing 2.5-2.625% and no-cash-out refis in the 2.75-2.875% neighborhood (this assumes a top tier conventional 30yr fixed loan with at least 20% equity, 740+ credit, and no other negative loan level price adjustments).Tuesday:
emphasis added
• Early, Corelogic House Price index for December.
• At 10:00 AM ET, the Q4 2020 Housing Vacancies and Homeownership from the Census Bureau.
• All day, Light vehicle sales for January. The consensus is for light vehicle sales to be 16.3 million SAAR in January, unchanged from 16.3 million in December (Seasonally Adjusted Annual Rate).
February 1 COVID-19 Test Results and Vaccinations
by Calculated Risk on 2/01/2021 07:09:00 PM
Note: Bloomberg has great data on vaccinations.
"In the U.S., more Americans have now received at least one dose than have tested positive for the virus since the pandemic began. Some 32.8 million doses have been given, most recently at an average rate of 1.34 million doses per day."Also check out the graphs at COVID-19 Vaccine Projections The site has several interactive graphs related to US COVID vaccinations including a breakdown of how many have had one shot, and how many have had both shots.
The US is now averaging close to 2 million tests per day. Based on the experience of other countries, for adequate test-and-trace (and isolation) to reduce infections, the percent positive needs to be under 5% (probably close to 1%), so the US has far too many daily cases - and percent positive - to do effective test-and-trace.
There were 1,610,238 test results reported over the last 24 hours.
There were 119,747 positive tests.
Over 1,500 US deaths have been reported in February. See the graph on US Daily Deaths here.
This data is from the COVID Tracking Project.
And check out COVID Act Now to see how each state is doing. (updated link to new site)
 Click on graph for larger image.
This graph shows the 7 day average of positive tests reported and daily hospitalizations.
The percent positive over the last 24 hours was 7.4%. The percent positive is calculated by dividing positive results by total tests (including pending).
It seems likely cases and hospitalizations have peaked, but are declining from a very high level.


