by Calculated Risk on 8/11/2021 05:30:00 PM
Wednesday, August 11, 2021
Des Moines Real Estate in July: Sales Down 9% YoY, Inventory Down 25% YoY
Note: I'm tracking data for many local markets around the U.S. I think it is especially important to watch inventory this year.
From the Des Moines Area Association of REALTORS®:
Closed sales in July 2021 were 1,703, down 8.7% from 1,866 in July 2020.
Active Listings in July 2021 were 2,086, down 25.1% from 2,785 in July 2020.
Inventory in July was up 13.5% from last month, and up 20% from the all time low in April 2021. Usually inventory peaks in the summer at between 3,500 and 4,100 in Des Moines, so this is still very low.
Early Look at 2022 Cost-Of-Living Adjustments and Maximum Contribution Base
by Calculated Risk on 8/11/2021 03:48:00 PM
The BLS reported this morning:
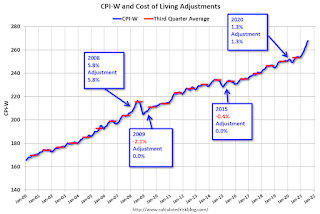
The Consumer Price Index for Urban Wage Earners and Clerical Workers (CPI-W) increased 6.0 percent over the last 12 months to an index level of 267.789 (1982-84=100). For the month, the index rose 0.5 percent prior to seasonal adjustment.CPI-W is the index that is used to calculate the Cost-Of-Living Adjustments (COLA). The calculation dates have changed over time (see Cost-of-Living Adjustments), but the current calculation uses the average CPI-W for the three months in Q3 (July, August, September) and compares to the average for the highest previous average of Q3 months. Note: this is not the headline CPI-U, and is not seasonally adjusted (NSA).
• In 2020, the Q3 average of CPI-W was 253.412.
The 2020 Q3 average was the highest Q3 average, so we only have to compare Q3 this year to last year.
 Click on graph for larger image.
This graph shows CPI-W since January 2000. The red lines are the Q3 average of CPI-W for each year.
Note: The year labeled for the calculation, and the adjustment is effective for December of that year (received by beneficiaries in January of the following year).
CPI-W was up 6.0% year-over-year in July, and although this is very early - we need the data for August and September - my current guess is COLA will probably be around 5.5% this year, the largest increase since 5.8% in 2008 - and it is possible this will be the largest increase since 1982 (7.4%).
Contribution and Benefit Base
The contribution base will be adjusted using the National Average Wage Index. This is based on a one year lag. The National Average Wage Index is not available for 2020 yet, but wages probably increased again in 2020. If wages increased the same as in 2019, then the contribution base next year will increase to around $148,200 in 2022, from the current $142,800.
Remember - this is an early look. What matters is average CPI-W, NSA, for all three months in Q3 (July, August and September).
Houston Real Estate in July: Sales Down 4% YoY, Inventory Down 21% YoY
by Calculated Risk on 8/11/2021 12:44:00 PM
I'm tracking sales and inventory for many local markets.
From the HAR: Houston Home Sales Show No Let-Up in July, Despite What The Numbers Say
By the numbers, Houston-area home sales were down this July compared to last. However, that is because COVID-related home closing delays during Q2 2020 finally pushed through that July as most of the pandemic lockdowns were lifted. The resulting surge of pent-up sales cemented July 2020 in the real estate history books as a record-setting month that could not be rivaled by the rapid-fire pace of the current market.Single family inventory declined 20.6% year-over-year from 34,364 in July 2020 to 27,268 in July 2021. This is just 1.8 months of supply compared to 2.9 months in July 2020.
According to the Houston Association of Realtors (HAR) July 2021 Market Update, single-family homes sales were down 6.1 percent compared to last July, with 10,159 units sold versus the historic 10,822 that sold a year earlier. However, when compared to July 2019 — an average month of home sales with volume totaling 8,921 — the Houston housing market was up 13.9 percent. On a year-to-date basis, local home sales currently exceed 2020’s record pace by 19.1 percent.
...
Sales of all property types fell 3.7 percent year-over-year, totaling 12,383. That is the third greatest volume of all time behind June 2021 (13,115) and July 2020 (12,865). Total dollar volume for the month rose 11.4 percent to $4.5 billion.
“We know anecdotally that the Houston real estate market is still red-hot, but the statistics make it appear to be slower than a year ago because of the surge in home closings that took place last July when the market began to normalize with the lifting of pandemic-related restrictions,” said HAR Chairman Richard Miranda with Keller Williams Platinum. “Assertive investors and cash buyers are still controlling the tides of this seller’s market, but hopefully that will moderate with a continued influx of new listings.”
emphasis added
Note that inventory was up 12.6% compared to the previous month, and up 20.6% compared to the record low in March 2021.
Charlotte Region Real Estate in July: Sales Down 10% YoY, Inventory Down 42% YoY
by Calculated Risk on 8/11/2021 12:26:00 PM
Note: I'm tracking data for many local markets around the U.S. I think it is especially important to watch inventory this year.
For the Charlotte Region:
Closed sales in July 2021 were 5,189, down 10.5% from 5,796 in July 2020.
Active Listings in July 2021 were 4,073, down 42.2% from 7,045 in July 2020.
Months of Supply was 0.8 Months in July 2021, compared to 1.6 Months in July 2020.
Inventory in July was up 17.6% from last month, and up 49.0% from the record low in March 2021.
Cleveland Fed: Key Measures of Inflation in July
by Calculated Risk on 8/11/2021 11:12:00 AM
The Cleveland Fed released the median CPI and the trimmed-mean CPI this morning:
According to the Federal Reserve Bank of Cleveland, the median Consumer Price Index rose 0.3% July. The 16% trimmed-mean Consumer Price Index rose 0.4% in July. "The median CPI and 16% trimmed-mean CPI are measures of core inflation calculated by the Federal Reserve Bank of Cleveland based on data released in the Bureau of Labor Statistics’ (BLS) monthly CPI report".
Note: The Cleveland Fed released the median CPI details for July here. "Lodging away from home" was up 101% annualized in July, however "Used cars and trucks" were down 43% annualized (reversing some of the previous increase).

This graph shows the year-over-year change for these four key measures of inflation. On a year-over-year basis, the median CPI rose 2.3%, the trimmed-mean CPI rose 3.0%, and the CPI less food and energy rose 4.3%. Core PCE is for June and increased 3.5% year-over-year.
Colorado Real Estate in July: Sales Down 13% YoY, Inventory Down 49% YoY
by Calculated Risk on 8/11/2021 09:13:00 AM
Note: I'm tracking data for many local markets around the U.S. I think it is especially important to watch inventory this year.
From the Colorado Association of REALTORS® for the entire state:
Closed sales for Single Family and Townhouse-Condo in July 2021 were 12,417, down 13.4% from 14,338 in July 2020.
Active Listings for Single Family and Townhouse-Condo in July 2021 were 11,126, down 49.3% from 21,959 in July 2020.
Months of Supply was 1.0 Months in July 2021, compared to 2.2 Months in July 2020.
Inventory in July was up 6.9% from last month, and up 27.3% from the record low in March 2021.
BLS: CPI increased 0.5% in July, Core CPI increased 0.3%
by Calculated Risk on 8/11/2021 08:32:00 AM
The Consumer Price Index for All Urban Consumers (CPI-U) increased 0.5 percent in July on a seasonally adjusted basis after rising 0.9 percent in June, the U.S. Bureau of Labor Statistics reported today. Over the last 12 months, the all items index increased 5.4 percent before seasonal adjustment.CPI was at expectations, and core CPI was slightly below expectations. I'll post a graph later today after the Cleveland Fed releases the median and trimmed-mean CPI.
The indexes for shelter, food, energy, and new vehicles all increased in July and contributed to the monthly all items seasonally adjusted increase. The food index increased 0.7 percent in July as five of the major grocery store food group indexes rose, and the food away from home index increased 0.8 percent. The energy index rose 1.6 percent in July, as the gasoline index increased 2.4 percent and other energy component indexes also rose.
The index for all items less food and energy rose 0.3 percent in July after increasing 0.9 percent in June. Along with shelter and new vehicles, the indexes for recreation, for medical care, and for personal care increased in July. The index for used cars also increased in July, but the 0.2-percent advance was much smaller than in recent months. The index for motor vehicle insurance declined in July, and the index for airline fares fell slightly.
The all items index rose 5.4 percent for the 12 months ending July, the same increase as the period ending June. The index for all items less food and energy rose 4.3 percent over the last 12 months, while the energy index rose 23.8 percent. The food index increased 3.4 percent for the 12 months ending July, compared to a 2.4-percent rise for the period ending June.
emphasis added
MBA: Mortgage Applications Increase in Latest Weekly Survey
by Calculated Risk on 8/11/2021 07:00:00 AM
From the MBA: Mortgage Applications Increase in Latest MBA Weekly Survey
Mortgage applications increased 2.8 percent from one week earlier, according to data from the Mortgage Bankers Association’s (MBA) Weekly Mortgage Applications Survey for the week ending August 6, 2021.
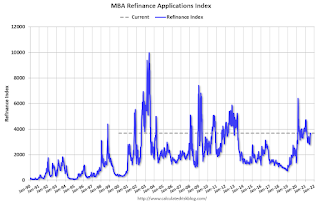
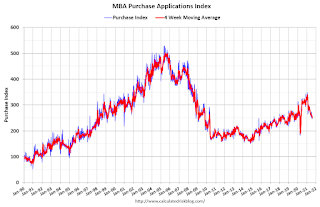
... The Refinance Index increased 3 percent from the previous week and was 8 percent lower than the same week one year ago. The seasonally adjusted Purchase Index increased 2 percent from one week earlier. The unadjusted Purchase Index increased 1 percent compared with the previous week and was 18 percent lower than the same week one year ago.
“Mortgage applications rebounded last week, including an increase in purchase applications for the first time in nearly a month. Rates slightly rose but remained below 3 percent, driven by an end-of-week increase in the 10-year Treasury yield following the positive July jobs report,” said Joel Kan, MBA’s Associate Vice President of Economic and Industry Forecasting. “Homeowners continue to respond to lower rates, with refinance activity climbing to the highest level since February 2021. The refinance share of loan counts was at 68 percent, compared to a 63.4 percent share for refinances by dollar volume, as purchase loans continue to see significantly higher loan sizes.”
Added Kan, “The higher level of purchase activity last week was driven by more government purchase applications, including a 3.3 percent increase in FHA loans. With low for-sale inventory keeping home-price appreciation in many markets at record highs, the jump in FHA purchase applications is potentially a sign that more first-time buyers are finding purchase options despite the high prices.”
...
The average contract interest rate for 30-year fixed-rate mortgages with conforming loan balances ($548,250 or less) increased to 2.99 percent from 2.97 percent, with points decreasing to 0.30 from 0.33 (including the origination fee) for 80 percent loan-to-value ratio (LTV) loans.
emphasis added
 Click on graph for larger image.
The first graph shows the refinance index since 1990.
With low rates, the index remains elevated.
The second graph shows the MBA mortgage purchase index
 According to the MBA, purchase activity is down 18% year-over-year unadjusted.
Note: The year ago comparisons for the unadjusted purchase index are now difficult since purchase activity picked up in late May 2020.
Note: Red is a four-week average (blue is weekly).
Tuesday, August 10, 2021
Wednesday: CPI
by Calculated Risk on 8/10/2021 09:00:00 PM
Wednesday:
• At 7:00 AM ET, The Mortgage Bankers Association (MBA) will release the results for the mortgage purchase applications index.
• At 8:30 AM, The Consumer Price Index for July from the BLS. The consensus is for a 0.5% increase in CPI, and a 0.4% increase in core CPI.
Sacramento Real Estate in July: Sales down 11% YoY, Active Inventory UP 27% YoY
by Calculated Risk on 8/10/2021 07:40:00 PM
Note: I'm tracking data for many local markets around the U.S. I think it is especially important to watch inventory this year.
From SacRealtor.org: Median sales price dips, inventory rises
July closed ended with 1,574 sales, an 8.6% decrease from June (1,723). Compared to one year ago (1,772), the current figure is down 11.2%.Note that inventory in July was up 23.5% from last month, and up 123% from the record low in January 2021.
...
The Active Listing Inventory increased 23.5% from June to July, from 1,297 units to 1,602 units. Compared with June 2020 (1,266), inventory is up 26.5%. The Months of Inventory increased from .8 Months to 1 Month. This figure represents the amount of time (in months) it would take for the current rate of sales to deplete the total active listing inventory.
emphasis added


