by Calculated Risk on 12/02/2021 10:44:00 AM
Thursday, December 02, 2021
Hotels: Occupancy Rate Up 5% Compared to Same Week in 2019; Record Thanksgiving Week Occupancy
Note: Since occupancy declined sharply at the onset of the pandemic, CoStar is comparing to 2019.
U.S. hotel performance came in higher than any other Thanksgiving week on record, according to STR‘s latest data through November 27.The following graph shows the seasonal pattern for the hotel occupancy rate using the four week average.
November 21-27, 2021 (percentage change from comparable week in 2019*):
• Occupancy: 53.0% (+4.6%)
• Average daily rate (ADR): $128.41 (+14.3%)
• Revenue per available room (RevPAR): $68.00 (+19.6%)
*Due to the steep, pandemic-driven performance declines of 2020, STR is measuring recovery against comparable time periods from 2019.
emphasis added
 Click on graph for larger image.
The red line is for 2021, black is 2020, blue is the median, dashed purple is 2019, and dashed light blue is for 2009 (the worst year on record for hotels prior to 2020).
Weekly Initial Unemployment Claims Increase to 222,000
by Calculated Risk on 12/02/2021 08:34:00 AM
The DOL reported:
In the week ending November 27, the advance figure for seasonally adjusted initial claims was 222,000, an increase of 28,000 from the previous week's revised level. The previous week's level was revised down by 5,000 from 199,000 to 194,000. The 4-week moving average was 238,750, a decrease of 12,250 from the previous week's revised average. This is the lowest level for this average since March 14, 2020 when it was 225,500. The previous week's average was revised down by 1,250 from 252,250 to 251,000The following graph shows the 4-week moving average of weekly claims since 1971.
emphasis added
 Click on graph for larger image.
The dashed line on the graph is the current 4-week average. The four-week average of weekly unemployment claims decreased to 238,750.
The previous week was revised down.
Regular state continued claims decreased to 1,956,000 (SA) from 2,063,000 (SA) the previous week.
Weekly claims were well below the consensus forecast.
Wednesday, December 01, 2021
November Vehicles Sales decreased to 12.9 million SAAR
by Calculated Risk on 12/01/2021 06:28:00 PM
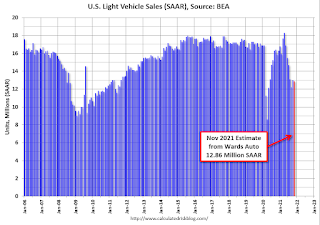
Wards Auto released their estimate of light vehicle sales for November. Wards Auto estimates sales of 12.86 million SAAR in November 2021 (Seasonally Adjusted Annual Rate), down 1.0% from the October sales rate, and down 19.0% from November 2020.
 Click on graph for larger image.
This graph shows light vehicle sales since 2006 from the BEA (blue) and Wards Auto's estimate for November (red).
The impact of COVID-19 was significant, and April 2020 was the worst month.
After April 2020, sales increased, and were close to sales in 2019 (the year before the pandemic).
December 1st COVID-19: Holiday Impacted Data
by Calculated Risk on 12/01/2021 05:00:00 PM
| COVID Metrics | ||||
|---|---|---|---|---|
| Today | Week Ago | Goal | ||
| Percent fully Vaccinated | 59.4% | --- | ≥70.0%1 | |
| Fully Vaccinated (millions) | 197.4 | --- | ≥2321 | |
| New Cases per Day3 | 82,846 | 94,368 | ≤5,0002 | |
| Hospitalized3🚩 | 47,004 | 44,061 | ≤3,0002 | |
| Deaths per Day3 | 816 | 990 | ≤502 | |
| 1 Minimum to achieve "herd immunity" (estimated between 70% and 85%). 2my goals to stop daily posts, 37-day average for Cases, Currently Hospitalized, and Deaths 🚩 Increasing 7-day average week-over-week for Cases, Hospitalized, and Deaths ✅ Goal met. | ||||
IMPORTANT: For "herd immunity" most experts believe we need 70% to 85% of the total population fully vaccinated (or already had COVID). Note: COVID will probably stay endemic (at least for some time).
The following 19 states have between 50% and 59.9% fully vaccinated: Wisconsin at 59.6%, Nebraska, Iowa, Utah, Michigan, Texas, Kansas, Arizona, Nevada, South Dakota, North Carolina, Alaska, Ohio, Kentucky, Montana, Oklahoma, South Carolina, Missouri and Indiana at 50.6%.
Next up (total population, fully vaccinated according to CDC) are Georgia at 49.7%, Tennessee at 49.6%, Arkansas at 49.4%, Louisiana at 48.9% and North Dakota at 48.9%.
 Click on graph for larger image.
This graph shows the daily (columns) and 7-day average (line) of positive tests reported.
Fed's Beige Book: "Economic activity grew at a modest to moderate pace"
by Calculated Risk on 12/01/2021 02:10:00 PM
Fed's Beige Book "This report was prepared at the Federal Reserve Bank of Chicago based on information collected on or before November 19, 2021."
Economic activity grew at a modest to moderate pace in most Federal Reserve Districts during October and early November. Several Districts noted that despite strong demand, growth was constrained by supply chain disruptions and labor shortages. Consumer spending increased modestly; low inventories held back sales of some items, notably light vehicles. Leisure and hospitality activity picked up in most Districts as the spread of the Delta variant ebbed in many areas. Construction activity generally increased but was held back by scarce materials and labor. Nonresidential real estate activity increased widely, while residential real estate activity grew in some Districts but declined in others. Manufacturing growth was solid across Districts, though materials and labor shortages limited expansion. High freight volumes continued to strain distribution systems. Energy activity was generally higher, growth in professional and business services varied widely, and demand for education and health services was largely unchanged. Loan demand increased in almost all Districts, though some reported declines in residential mortgages. Agriculture saw improved financial conditions overall and rising land values. The outlook for overall activity remained positive in most Districts, but some noted uncertainty about when supply chain and labor supply challenges would ease.
...
Employment growth ranged from modest to strong across Federal Reserve Districts. Contacts reported robust demand for labor but persistent difficulty in hiring and retaining employees. Leisure and hospitality and manufacturing contacts reported an uptick in employment, but many were still limiting operating hours due to a lack of workers. Contacts in several other sectors also noted labor-related constraints on meeting demand. Childcare, retirements, and COVID safety concerns were widely cited as sources that limited labor supply. Many Districts noted concerns that the federal vaccination mandate could exacerbate existing hiring difficulties. Nearly all Districts reported robust wage growth. Hiring struggles and elevated turnover rates led businesses to raise wages and offer other incentives, such as bonuses and more flexible working arrangements.
emphasis added
Real House Prices, Price-to-Rent Ratio and Affordability in September
by Calculated Risk on 12/01/2021 11:53:00 AM
Today, in the Real Estate Newsletter: Real House Prices, Price-to-Rent Ratio and Price-to-Median Income in September; And a look at "Affordability"
Excerpt (there is much more):
In October 2004, Fed economist John Krainer and researcher Chishen Wei wrote a Fed letter on price to rent ratios: House Prices and Fundamental Value. Kainer and Wei presented a price-to-rent ratio using the OFHEO house price index and the Owners' Equivalent Rent (OER) from the BLS.
Here is a similar graph using the Case-Shiller National and Composite 20 House Price Indexes. This graph shows the price to rent ratio (January 2000 = 1.0). The price-to-rent ratio had been moving more sideways but picked up significantly recently.
On a price-to-rent basis, the Case-Shiller National index is back to January 2006 levels, and the Composite 20 index is back to March 2005 levels.
Construction Spending Increased 0.2% in October
by Calculated Risk on 12/01/2021 10:18:00 AM
From the Census Bureau reported that overall construction spending increased 0.2%:
Construction spending during October 2021 was estimated at a seasonally adjusted annual rate of $1,598.0 billion, 0.2 percent above the revised September estimate of $1,594.8 billion. The October figure is 8.6 percent above the October 2020 estimate of $1,471.7 billion.Private spending decreased and public spending increased:
emphasis added
Spending on private construction was at a seasonally adjusted annual rate of $1,245.0 billion, 0.2 percent below the revised September estimate of $1,247.9 billion....
In October, the estimated seasonally adjusted annual rate of public construction spending was $353.0 billion, 1.8 percent above the revised September estimate of $346.8 billion.
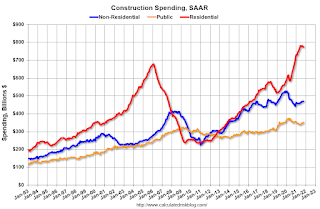
 Click on graph for larger image.
This graph shows private residential and nonresidential construction spending, and public spending, since 1993. Note: nominal dollars, not inflation adjusted.
Residential spending is 14% above the bubble peak (in nominal terms - not adjusted for inflation).
Non-residential spending is 13% above the bubble era peak in January 2008 (nominal dollars), but has been soft recently.
Public construction spending is 8% above the peak in March 2009.
 The second graph shows the year-over-year change in construction spending.
On a year-over-year basis, private residential construction spending is up 16.7%. Non-residential spending is up 3.1% year-over-year. Public spending is up 0.4% year-over-year.
Construction was considered an essential service during the early months of the pandemic in most areas, and did not decline sharply like many other sectors. However, some sectors of non-residential have been under pressure. For example, lodging is down 32.4% YoY.
ISM® Manufacturing index increased to 61.1% in November
by Calculated Risk on 12/01/2021 10:04:00 AM
(Posted with permission). The ISM manufacturing index indicated expansion in November. The PMI® was at 61.1% in November, down from 60.8% in October. The employment index was at 53.3%, up from 52.0% last month, and the new orders index was at 61.5%, up from 59.8%.
From ISM: Manufacturing PMI® at 61.1% November 2021 Manufacturing ISM® Report On Business®
Economic activity in the manufacturing sector grew in November, with the overall economy achieving an 18th consecutive month of growth, say the nation’s supply executives in the latest Manufacturing ISM® Report On Business®.This was at expectations, and this suggests manufacturing expanded at a slightly faster pace in November than in October.
The report was issued today by Timothy R. Fiore, CPSM, C.P.M., Chair of the Institute for Supply Management® (ISM®) Manufacturing Business Survey Committee:
“The November Manufacturing PMI® registered 61.1 percent, an increase of 0.3 percentage point from the October reading of 60.8 percent. This figure indicates expansion in the overall economy for the 18th month in a row after a contraction in April 2020. The New Orders Index registered 61.5 percent, up 1.7 percentage points compared to the October reading of 59.8 percent. The Production Index registered 61.5 percent, an increase of 2.2 percentage points compared to the October reading of 59.3 percent. The Prices Index registered 82.4 percent, down 3.3 percentage points compared to the October figure of 85.7 percent. The Backlog of Orders Index registered 61.9 percent, 1.7 percentage points lower than the October reading of 63.6 percent. The Employment Index registered 53.3 percent, 1.3 percentage points higher compared to the October reading of 52 percent. The Supplier Deliveries Index registered 72.2 percent, down 3.4 percentage points from the October figure of 75.6 percent. The Inventories Index registered 56.8 percent, 0.2 percentage point lower than the October reading of 57 percent. The New Export Orders Index registered 54 percent, a decrease of 0.6 percentage point compared to the October reading of 54.6 percent. The Imports Index registered 52.6 percent, a 3.5-percentage point increase from the October reading of 49.1 percent.”
emphasis added
ADP: Private Employment increased 534,000 in November
by Calculated Risk on 12/01/2021 08:19:00 AM
Private sector employment increased by 534,000 jobs from October to November according to the November ADP® National Employment ReportTM. Broadly distributed to the public each month, free of charge, the ADP National Employment Report is produced by the ADP Research Institute® in collaboration with Moody’s Analytics. The report, which is derived from ADP’s actual data of those who are on a company’s payroll, measures the change in total nonfarm private employment each month on a seasonally-adjusted basisThis was close to the consensus forecast of 525,000 for this report.
“The labor market recovery continued to power through its challenges last month,” said Nela Richardson, chief economist, ADP. “November’s job gains bring the three month average to 543,000 monthly jobs added, a modest uptick from the job pace earlier this year. Job gains have eclipsed 15 million since the recovery began, though 5 million jobs short of pre-pandemic levels. Service providers, which are more vulnerable to the pandemic, have dominated job gains this year. It’s too early to tell if the Omicron variant could potentially slow the jobs recovery in coming months.”
emphasis added
The BLS report will be released Friday, and the consensus is for 563 thousand non-farm payroll jobs added in November. The ADP report has not been very useful in predicting the BLS report.
MBA: Mortgage Applications Decrease in Latest Weekly Survey
by Calculated Risk on 12/01/2021 07:00:00 AM
From the MBA: Mortgage Applications Decrease in Latest MBA Weekly Survey
Mortgage applications decreased 7.2 percent from one week earlier, according to data from the Mortgage Bankers Association’s (MBA) Weekly Mortgage Applications Survey for the week ending November 26, 2021. This week’s results include an adjustment for the Thanksgiving holiday.
... The Refinance Index decreased 15 percent from the previous week and was 41 percent lower than the same week one year ago. The seasonally adjusted Purchase Index increased 5 percent from one week earlier. The unadjusted Purchase Index decreased 30 percent compared with the previous week and was 8 percent lower than the same week one year ago.
“Mortgage rates rose for the third week in a row, reducing the refinance incentive for many borrowers. The 30-year fixed rate hit 3.31 percent – the highest since this April – and led to refinance applications falling more than 14 percent. Over the past three weeks, rates are up 15 basis points and refinance activity has declined over 18 percent,” said Joel Kan, MBA’s Associate Vice President of Economic and Industry Forecasting. “Despite higher mortgage rates, purchase applications had a strong week, mostly driven by a 6 percent increase in conventional loan applications. Conventional loans tend to be larger than government loans, and this was evident in the average loan amount, which increased to $414,700 – the highest since February 2021. As home-price appreciation continues at a double-digit pace, buyers of newer, pricier homes continue to dominate purchase activity, while the share of first-time buyer activity remains depressed.”
...
The average contract interest rate for 30-year fixed-rate mortgages with conforming loan balances ($548,250 or less) increased to 3.31 percent from 3.24 percent, with points increasing to 0.43 from 0.36 (including the origination fee) for 80 percent loan-to-value ratio (LTV) loans.
emphasis added
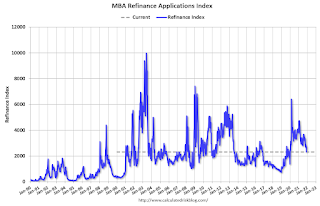
 Click on graph for larger image.
The first graph shows the refinance index since 1990.
With relatively low rates, the index remains slightly elevated, but down sharply from last year - and at the lowest level since January 2020.
The second graph shows the MBA mortgage purchase index
 According to the MBA, purchase activity is down 8% year-over-year unadjusted.
Note: Red is a four-week average (blue is weekly).


