 RSS Feed
 by Calculated Risk on 12/08/2021 07:00:00 AM
Wednesday, December 08, 2021
MBA: Mortgage Applications Increase in Latest Weekly Survey
From the MBA: Mortgage Applications Increase in Latest MBA Weekly Survey
Mortgage applications increased 2.0 percent from one week earlier, according to data from the Mortgage Bankers Association’s (MBA) Weekly Mortgage Applications Survey for the week ending December 3, 2021. The previous week’s results included an adjustment for the Thanksgiving holiday.
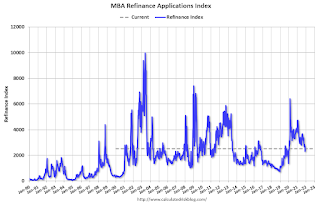
... The Refinance Index increased 9 percent from the previous week and was 37 percent lower than the same week one year ago. The seasonally adjusted Purchase Index decreased 5 percent from one week earlier. The unadjusted Purchase Index increased 28 percent compared with the previous week and was 8 percent lower than the same week one year ago.
“Mortgage rates declined for the first time in a month, prompting a pickup in refinancing, with government refinances increasing more than 20 percent over the week. While the 30-year fixed mortgage rate and 15- year fixed mortgage rate both declined only one basis point, the FHA rate fell 7 basis points, driving the surge in government refinances. Borrowers are continuing to act on these opportunities, but if rates trend higher as MBA is forecasting, the window of opportunity to refinance will continue to get smaller,” said Joel Kan, MBA’s Associate Vice President of Economic and Industry Forecasting. “The purchase market was slower last week, with applications falling after four consecutive increases. Activity is still close to the highest level since March 2021, which is a positive sign as the year comes to an end. Purchase activity continues to be constrained by a lack of inventory, combined with rapid rates of home-price appreciation and mortgage rates higher than in 2020.”
...
The average contract interest rate for 30-year fixed-rate mortgages with conforming loan balances ($548,250 or less) decreased to 3.30 percent from 3.31 percent, with points decreasing to 0.39 from 0.43 (including the origination fee) for 80 percent loan-to-value ratio (LTV) loans.
emphasis added
 Click on graph for larger image.
The first graph shows the refinance index since 1990.
With relatively low rates, the index remains slightly elevated, but down sharply from last year.
The second graph shows the MBA mortgage purchase index
 According to the MBA, purchase activity is down 8% year-over-year unadjusted.
Note: Red is a four-week average (blue is weekly).
Tuesday, December 07, 2021
Wednesday: Job Openings
by Calculated Risk on 12/07/2021 07:01:00 PM
Wednesday:
• At 7:00 AM ET, The Mortgage Bankers Association (MBA) will release the results for the mortgage purchase applications index.
• At 10:00 AM, Job Openings and Labor Turnover Survey for October from the BLS.
And on COVID:
 Click on graph for larger image.
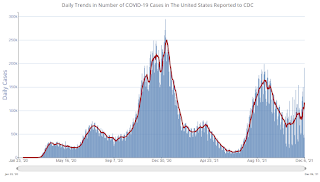
This graph shows the daily (columns) and 7-day average (line) of positive tests reported.
| COVID Metrics | ||||
|---|---|---|---|---|
| Today | Week Ago | Goal | ||
| Percent fully Vaccinated | 60.1% | --- | ≥70.0%1 | |
| Fully Vaccinated (millions) | 199.7 | --- | ≥2321 | |
| New Cases per Day3🚩 | 117,179 | 80,266 | ≤5,0002 | |
| Hospitalized3🚩 | 51,742 | 46,659 | ≤3,0002 | |
| Deaths per Day3🚩 | 1,117 | 807 | ≤502 | |
| 1 Minimum to achieve "herd immunity" (estimated between 70% and 85%). 2my goals to stop daily posts, 37-day average for Cases, Currently Hospitalized, and Deaths 🚩 Increasing 7-day average week-over-week for Cases, Hospitalized, and Deaths ✅ Goal met. | ||||
Click on graph for larger image.This graph shows the daily (columns) and 7-day average (line) of positive tests reported.
Leading Index for Commercial Real Estate "Declines in November"; Up Sharply Year-over-year
by Calculated Risk on 12/07/2021 03:06:00 PM
From Dodge Data Analytics: Dodge Momentum Index Declines In November
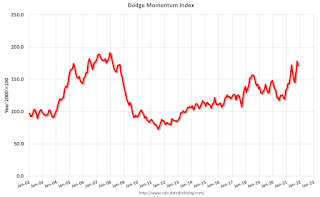
The Dodge Momentum Index fell 4% in November to 171.7 (2000=100) — down from the revised October reading of 178.1. The Momentum Index, issued by Dodge Construction Network, is a monthly measure of the initial report for nonresidential building projects in planning, which have been shown to lead construction spending for nonresidential buildings by a full year. In November, commercial planning fell 8% while institutional planning moved 5% higher.
The value of nonresidential building projects continues to move in a sawtooth pattern, alternating between a month of gains followed by a loss. Since the pandemic began, nonresidential building projects entering planning have been more volatile than in past cycles, likely driven by increased challenges from higher prices and lack of labor.
Despite these issues and a lack of underlying demand for some building types such as offices and hotels, the Momentum Index remains near a 14-year high. Compared to November 2020, the Momentum Index was 44% higher in November 2021. The commercial planning component was 45% higher, and institutional was 41% higher.
emphasis added
 Click on graph for larger image.
This graph shows the Dodge Momentum Index since 2002. The index was at 171.7 in November, down from 178.1 in October.
According to Dodge, this index leads "construction spending for nonresidential buildings by a full year". This index suggested a decline in Commercial Real Estate construction through most of 2021, but a pickup towards the end of the year, and growth in 2022.
1st Look at Local Housing Markets in November
by Calculated Risk on 12/07/2021 10:51:00 AM
Today, in the Real Estate Newsletter: 1st Look at Local Housing Markets in November
Excerpt:
Denver, Las Vegas, Northwest (Seattle), and San Diego
From Denver Metro Association of Realtors® (DMAR): DMAR Real Estate Market Trends ReportFrom October to November, the market saw a staggering 33.41 percent decrease in month-end active inventory, dropping to 2,248. Throughout the entire Denver Metro area, there are currently only 1,444 single-family detached properties and 804 attached properties to buy.
Over the past five years, month-end active inventory dropped between 23.36 percent in 2016 and 27.92 percent in 2019. Theoretically, if inventory stayed the course and dropped 25 percent this year, the market would end the year at 1,686 active properties leading into 2022, which is drastically lower than the end of 2020 and would lead to the most competitive year yet. With 2,248 active listings on the market and that number expected to go down by the end of the month, expectations are set that 2022 will be a wild and competitive ride.
emphasis addedHere is a summary of active listings for these housing markets in November. Inventory was down 27.2% in November MoM from October, and down 36.3% YoY.
Inventory almost always declines seasonally in November, so the MoM decline is not a surprise. Last month, these four markets were down 33% YoY, so the YoY decline in November is larger than in October. This isn’t indicating a slowing market.

Trade Deficit Decreased to $67.1 Billion in October
by Calculated Risk on 12/07/2021 08:39:00 AM
From the Department of Commerce reported:
The U.S. Census Bureau and the U.S. Bureau of Economic Analysis announced today that the goods and services deficit was $67.1 billion in October, down $14.3 billion from $81.4 billion in September, revised.
October exports were $223.6 billion, $16.8 billion more than September exports. October imports were $290.7 billion, $2.5 billion more than September imports.
emphasis added
 Click on graph for larger image.
Both exports and imports increased in October.
Exports are up 18% compared to October 2020; imports are up 22% compared to October 2020.
Both imports and exports decreased sharply due to COVID-19, and have now bounced back (imports more than exports),
The second graph shows the U.S. trade deficit, with and without petroleum.
 The blue line is the total deficit, and the black line is the petroleum deficit, and the red line is the trade deficit ex-petroleum products.
Note that net, imports and exports of petroleum products are close to zero.
The trade deficit with China increased to $31.4 billion in October, from $30.0 billion in October 2020.
CoreLogic: House Prices up 18% YoY in October
by Calculated Risk on 12/07/2021 08:00:00 AM
Notes: This CoreLogic House Price Index report is for October. The recent Case-Shiller index release was for September. The CoreLogic HPI is a three month weighted average and is not seasonally adjusted (NSA).
From CoreLogic: US Annual Home Price Growth at a Record 18% in October, CoreLogic Reports
CoreLogic® ... today released the CoreLogic Home Price Index (HPI™) and HPI Forecast™ for October 2021.
U.S. annual home price growth remained strong at 18% in October, the highest recorded in the 45-year history of the index. Nonetheless, monthly price growth has slowed from its April peak and signals a moderation in price growth that the CoreLogic HPI Forecast projects will continue to slow in coming months.
Despite affordability challenges, a recent CoreLogic consumer survey shows that over half of respondents across every age cohort said that owning a home has always been a goal of theirs — further supporting the outlook that consumer desire for homeownership remains.
“New household formation, investor purchases and pandemic-related factors driving demand for the limited supply of available for-sale homes continues to propel the upward spiral of U.S. home prices,” said Frank Martell, president and CEO of CoreLogic. “However, we expect home price growth to moderate over the near term as many buyers take a break for the holidays.”
...
Nationally, home prices increased 18% in October 2021, compared to October 2020. On a month-over-month basis, home prices increased by 1.3% compared to September 2021.
...
Home price gains are projected to slow to a 2.5% increase by October 2022 as affordability and economic concerns deter some potential buyers and additional for-sale inventory becomes available.
"Single-family detached houses remain the preferred home for buyers during the pandemic,” said Dr. Frank Nothaft, chief economist at CoreLogic. “This is reflected in the 19.5% annual price rise for detached houses, which marks another record-high for the CoreLogic Home Price Index.”
emphasis added
Monday, December 06, 2021
Tuesday: Trade Deficit, Corelogic House Prices
by Calculated Risk on 12/06/2021 07:17:00 PM
From Matthew Graham at Mortgage News Daily: Mortgage Rates Started Flat, But Moved Higher in The Afternoon
Mortgage rates have been in a very narrow, sideways range since October. During that time, the average 30yr fixed rate hasn't moved by more than an eighth of a percent in either direction. Today was no exception.Tuesday:
...
These so-called mid-day reprices can happen in either direction. It didn't look like we would see any today based on market movement in the first 90 minutes. After that, bond began to deteriorate, ultimately forcing lenders to issue negative reprices. Keep in mind that we're dealing with very small adjustments in the bigger picture. The point is that rates are now slightly higher than they were on Friday afternoon. [30 year fixed 3.22%]
emphasis added
• At 8:00 AM ET, Corelogic House Price index for October.
• At 8:30 AM, Trade Balance report for October from the Census Bureau. The consensus is the trade deficit to be $67.0 billion. The U.S. trade deficit was at $80.9 billion in September.
December 6th COVID-19: 60% of US Population Fully Vaccinated
by Calculated Risk on 12/06/2021 03:09:00 PM
The CDC is the source for all data.
According to the CDC, on Vaccinations. Total doses administered: 471,700,443.
| COVID Metrics | ||||
|---|---|---|---|---|
| Today | Week Ago | Goal | ||
| Percent fully Vaccinated | 60.0% | --- | ≥70.0%1 | |
| Fully Vaccinated (millions) | 199.3 | --- | ≥2321 | |
| New Cases per Day3🚩 | 103,823 | 87,603 | ≤5,0002 | |
| Hospitalized3🚩 | 49,176 | 46,003 | ≤3,0002 | |
| Deaths per Day3🚩 | 1,154 | 733 | ≤502 | |
| 1 Minimum to achieve "herd immunity" (estimated between 70% and 85%). 2my goals to stop daily posts, 37-day average for Cases, Currently Hospitalized, and Deaths 🚩 Increasing 7-day average week-over-week for Cases, Hospitalized, and Deaths ✅ Goal met. | ||||
IMPORTANT: For "herd immunity" most experts believe we need 70% to 85% of the total population fully vaccinated (or already had COVID). Note: COVID will probably stay endemic (at least for some time).
KUDOS to the residents of the 5 states that have achieved 70% of total population fully vaccinated: Vermont at 74.0%, Rhode Island, Connecticut, Maine, and Massachusetts at 72.2%.
KUDOS also to the residents of the 16 states and D.C. that have achieved 60% of total population fully vaccinated: New York at 69.2%, New Jersey, Maryland, Washington, Virginia, New Hampshire, Oregon, District of Columbia, New Mexico, Colorado, California, Minnesota, Illinois, Delaware, Florida, Hawaii, and Wisconsin at 60.2%.
The following 19 states have between 50% and 59.9% fully vaccinated: Pennsylvania at 59.3%, Nebraska, Iowa, Utah, Michigan, Texas, Kansas, Arizona, Nevada, South Dakota, North Carolina, Alaska, Ohio, Kentucky, Montana, Oklahoma, South Carolina, Missouri and Indiana at 51.0%.
Next up (total population, fully vaccinated according to CDC) are Tennessee at 49.8%, Arkansas at 49.8%, Georgia at 49.4%, Louisiana at 49.2%, North Dakota at 49.2%, and West Virginia at 49.2%.
 Click on graph for larger image.
This graph shows the daily (columns) and 7-day average (line) of positive tests reported.
As Forbearance Ends
by Calculated Risk on 12/06/2021 02:54:00 PM
Today, in the Real Estate Newsletter: As Forbearance Ends
Excerpt:
An analysis from Black Knight today, in their monthly mortgage monitor, indicates most borrowers are successfully leaving forbearance. Out of the 7.7 million borrowers that entered COVID related forbearance, only a small fraction are in foreclosure or delinquent (and not in active loss mitigation). Here is a chart from Black Knight:
...
In a previous post, Forbearance Will Not Lead to a Huge Wave of Foreclosures, I presented some data and argued “that most homeowners in forbearance have sufficient equity in their homes, and there will not be a huge wave of foreclosures like following the housing bubble.”
So far, the data suggests the vast majority of borrowers that were in forbearance will return to current status. I’ll continue to track the data over the next few months, but this isn’t a huge concern.

Black Knight Mortgage Monitor for September: "More than 750K borrowers left forbearance plans over the past 45 days"
by Calculated Risk on 12/06/2021 12:24:00 PM
Black Knight released their Mortgage Monitor report for September today. According to Black Knight, 3.74% of mortgage were delinquent in September, down from 3.91% of mortgages in August, and down from 6.44% in September 2020. Black Knight also reported that 0.26% of mortgages were in the foreclosure process, down from 0.33% a year ago.
This gives a total of 4.07% delinquent or in foreclosure.
Press Release: Tappable Equity Surges $254 Billion in Q3 to All-Time High of $9.4 Trillion as Cash-Out Refinance Borrowers Pull Largest Quarterly Volume of Equity in 14 Years
Today, the Data & Analytics division of Black Knight, Inc. (NYSE:BKI) released its latest Mortgage Monitor Report, based upon the company’s industry-leading mortgage, real estate and public records datasets. Though the rate of home price appreciation has begun to slow in recent months, the explosive growth of the last few years has driven tappable equity – the amount available for a mortgage holder to access while retaining at least a 20% equity stake in their home – to one new height after another. According to Black Knight Data & Analytics President Ben Graboske, a nearly-quarter-trillion dollar increase in tappable equity over the third quarter has resulted in not only yet another record high, but also the lowest total market leverage on record.
“Home price growth in the third quarter – while less than half that of Q2’s history-making rate – added more than $250 billion to Americans’ already record levels of tappable equity,” said Graboske. “The aggregate total of $9.4 trillion is up an astonishing 32% from the same time last year and nearly 90% higher than the pre-Great Recession peak in 2006. As prices have surged over the past 18 months, the average mortgage-holder’s equity stake has risen by $53,000. That works out to nearly $178,000 available in tappable equity to the average homeowner with a mortgage before hitting a maximum combined loan-to-value ratio of 80%. What’s more, in the third quarter, homeowners tapped into their equity at the highest rate in more than 14 years as cash-outs made up 54% of all refinances.
...
This month’s Mortgage Monitor also examines the impact of rising prices and interest rates on home affordability, finding that the monthly mortgage payment (principal and interest) to purchase the average-priced home with 20% down has jumped by nearly 25% since the start of the year. Factoring in incomes as well as prices across the country, it now requires 22.4% of the median income to purchase the average-priced home with 20% down and a 30-year mortgage. This is the largest share of income required for a home purchase since late 2018, when interest rates were near 5%, but still far below the 34%+ payment-to-income ratio reached in 2006.
emphasis added
 Click on graph for larger image.
Here is a graph on delinquencies from Black Knight:
• The national delinquency rate, at 3.74%, is just over a half percentage point above the all-time low, set in January 2020
• Serious delinquencies fell by more than 10% (-127K) in October as the first wave of forbearance entrants returned to making mortgage payments
• Further improvement is expected in coming weeks as most borrowers exiting forbearance plans are still working through loss mitigation options with their lenders
• There are still nearly 700K more seriously delinquent mortgages (including those in active forbearance plans) than there were prior to the pandemic
 And on the current status of loans that have exited forbearance:
 • More than 750K borrowers left forbearance plans over the past 45 days, and while the dust continues to settle on their post-forbearance performance, early trends are like other recent exit monthsThere is much more in the mortgage monitor.
• Trends are also becoming clearer among earlier forbearance exits, with fewer than 15% of borrowers who left plans in May remaining either delinquent (8%) or in post-forbearance loss mitigation (5%), a share that falls below 10% among those exiting before the end of April
• Among borrowers who left plans from September through November, only 7% are no longer in loss mitigation and remain delinquent, but 38% of such exits – and as many as 53% of those who exited in early November – remain in loss mitigation, as servicers and borrowers work through available options
• Given the large volume of exit activity over the past 45 days, all eyes will be on the success rate of those loss mitigation efforts in coming weeks


