 RSS Feed
 by Calculated Risk on 2/01/2022 08:00:00 AM
Tuesday, February 01, 2022
CoreLogic: House Prices up 18.5% YoY in December
Notes: This CoreLogic House Price Index report is for December. The recent Case-Shiller index release was for November. The CoreLogic HPI is a three-month weighted average and is not seasonally adjusted (NSA).
From CoreLogic: CoreLogic Reports Upward Trend in Annual Home Price Appreciation Continues; Up 18.5% in December
CoreLogic® ... today released the CoreLogic Home Price Index (HPI™) and HPI Forecast™ for December 2021.
Consumer desire for homeownership against persistently low supply of for-sale homes created one of the hottest housing markets in decades in 2021 — and spurred record-breaking home price growth. Price appreciation averaged 15% for the full year of 2021, up from the 2020 full year average of 6%. Home price growth in 2021 started off at 10% in the first quarter, steadily increasing and ending the year with an increase of 18% for the fourth quarter.
While there have been questions surrounding whether we are currently in a housing bubble, the CoreLogic Market Risk Indicators suggest a small probability of a nationwide price decline, and points to the larger likelihood that a fall in price will be limited to specific, at-risk markets. Still, the CoreLogic HPI Forecast shows the national 12-month growth steadily slowing over 2022. During the early months of the year, it’s projected to remain above 10% while decelerating each month to a 12-month rise of 3.5% by December 2022. Comparing the average projected National HPI for 2022 with the previous year, the CoreLogic HPI Forecast shows the annual average up 9.6% in 2022.
"Much of what we’ve seen in the run-up of home prices over the last year has been the result of a perfect storm of supply and demand pressures,” said Dr. Frank Nothaft, chief economist at CoreLogic. “As we move further into 2022, economic factors – such as new home building and a rise in mortgage rates – are in motion to help relieve some of this pressure and steadily temper the rapid home price acceleration seen in 2021.”
...
Nationally, home prices increased 18.5% in December 2021, compared to December 2020. On a month-over-month basis, home prices increased by 1.3% compared to November 2021.
...
Home price gains are projected to slow to a 3.5% annual increase by December 2022.
emphasis added
Monday, January 31, 2022
Tuesday: Construction Spending, Job Openings, ISM Mfg
by Calculated Risk on 1/31/2022 08:03:00 PM
From Matthew Graham at Mortgage News Daily: Mortgage Rates in a Lull After January's Rapid Rise
... we're in a holding pattern ... As for today itself, most lenders offered just slightly lower rates compared to last Friday, but still well within the range seen last week. [30 year fixed 3.68%]Tuesday:
emphasis added
• At 8:00 AM ET, Corelogic House Price index for December.
• At 10:00 AM, Construction Spending for December. The consensus is for a 0.6% increase in construction spending.
• Also, at 10:00 AM, Job Openings and Labor Turnover Survey for December from the BLS.
• Also, at 10:00 AM, ISM Manufacturing Index for January. The consensus is for the ISM to be at 57.5, down from 58.8 in December.
On COVID (focus on hospitalizations and deaths):
| COVID Metrics | ||||
|---|---|---|---|---|
| Now | Week Ago | Goal | ||
| Percent fully Vaccinated | 63.8% | --- | ≥70.0%1 | |
| Fully Vaccinated (millions) | 211.8 | --- | ≥2321 | |
| New Cases per Day3 | 497,296 | 680,381 | ≤5,0002 | |
| Hospitalized3 | 126,699 | 145,610 | ≤3,0002 | |
| Deaths per Day3🚩 | 2,234 | 2,023 | ≤502 | |
| 1 Minimum to achieve "herd immunity" (estimated between 70% and 85%). 2my goals to stop daily posts, 37-day average for Cases, Currently Hospitalized, and Deaths 🚩 Increasing 7-day average week-over-week for Cases, Hospitalized, and Deaths ✅ Goal met. | ||||
 Click on graph for larger image.
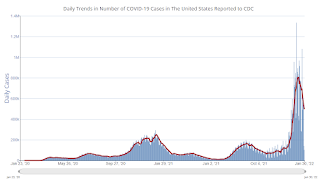
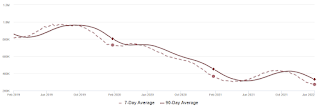
This graph shows the daily (columns) and 7-day average (line) of positive tests reported.
New cases and hospitalizations are now declining.
Unfortunately, deaths are still rising, but well below the previous 7-day average record of 3,421 in January 2021.
Fannie Mae: Mortgage Serious Delinquency Rate Decreased in December
by Calculated Risk on 1/31/2022 04:06:00 PM
Fannie Mae reported that the Single-Family Serious Delinquency decreased to 1.25% in December, from 1.33% in November. The serious delinquency rate is down from 2.87% in December 2020.
These are mortgage loans that are "three monthly payments or more past due or in foreclosure".
The Fannie Mae serious delinquency rate peaked in February 2010 at 5.59% following the housing bubble and peaked at 3.32% in August 2020 during the pandemic.

By vintage, for loans made in 2004 or earlier (1% of portfolio), 3.48% are seriously delinquent (down from 3.61% in November).
For loans made in 2005 through 2008 (2% of portfolio), 5.87% are seriously delinquent (down from 6.05%),
For recent loans, originated in 2009 through 2021 (97% of portfolio), 1.01% are seriously delinquent (down from 1.08%). So, Fannie is still working through a few poor performing loans from the bubble years.
Mortgages in forbearance are counted as delinquent in this monthly report, but they will not be reported to the credit bureaus.
This is very different from the increase in delinquencies following the housing bubble. Lending standards have been fairly solid over the last decade, and most of these homeowners have equity in their homes - and they will be able to restructure their loans once they are employed.
Freddie Mac reported earlier.
Median vs Repeat Sales Index House Prices
by Calculated Risk on 1/31/2022 12:50:00 PM
Today, in the Calculated Risk Real Estate Newsletter: Median vs Repeat Sales Index House Prices
Excerpt:
Back in October, I wrote The Coming Deceleration in House Price Growth. In that post, I noted that the median prices (as reported by the National Association of Realtors® (NAR) was showing a slowdown in year-over-year (YoY) house price growth.
In October ... the YoY growth in median prices started falling - and I expected Case-Shiller to follow.
Sure enough, the YoY growth in the Case-Shiller has shown deceleration.
...
The Case-Shiller index will probably show slower YoY growth over the next couple of reports, however median prices have picked up over the last two months - so there isn’t evidence of a sharp decline in the YOY growth.
emphasis added

There is much more in the article. You can subscribe at https://calculatedrisk.substack.com/
Housing Inventory January 31st Update: Inventory Down 1.9% Week-over-week; New Record Low
by Calculated Risk on 1/31/2022 09:50:00 AM
Tracking existing home inventory is very important in 2022.
Inventory usually declines in the winter, and this is a new record low for this series.
This inventory graph is courtesy of Altos Research.
As of January 28th, inventory was at 272 thousand (7-day average), compared to 367 thousand for the same week a year ago. That is a decline of 25.9%. A week ago, inventory was at 277 thousand, and was down 27.1% YoY. So, the YoY percentage decline is now getting smaller (something to watch).
Inventory was down 1.9% from the previous week.
Compared to the same week in 2020, inventory is down 62.8% from 732 thousand.
Last year, seasonally, inventory bottomed in April 2021 - very late - usually inventory bottoms in January or February. An early key in 2022 will be to watch if inventory bottoms earlier this year.
Mike Simonsen discusses this data regularly on Youtube.
Six High Frequency Indicators for the Economy
by Calculated Risk on 1/31/2022 08:24:00 AM
These indicators are mostly for travel and entertainment. It is interesting to watch these sectors recover as the pandemic subsides.
There is a clear negative impact from the omicron variant of COVID.
Note: Gasoline consumption returned to pre-pandemic levels.
----- Airlines: Transportation Security Administration -----
The TSA is providing daily travel numbers.
This data is as of January 30th.
 Click on graph for larger image.
This data shows the 7-day average of daily total traveler throughput from the TSA for 2019 (Light Blue), 2020 (Black), 2021 (Blue) and 2021 (Red).
The dashed line is the percent of 2019 for the seven-day average.
The 7-day average is down 23.4% from the same day in 2019 (76.6% of 2019). (Dashed line)
----- Restaurants: OpenTable -----
The second graph shows the 7-day average of the year-over-year change in diners as tabulated by OpenTable for the US and several selected cities.
----- Movie Tickets: Box Office Mojo -----
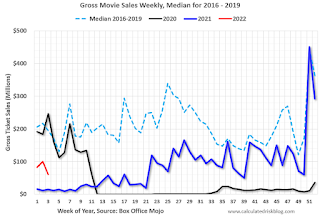 This data shows domestic box office for each week and the median for the years 2016 through 2019 (dashed light blue).
----- Hotel Occupancy: STR -----
 This graph shows the seasonal pattern for the hotel occupancy rate using the four-week average.
The red line is for 2022, black is 2020, blue is the median, and dashed light blue is for 2021.
This data is through January 22nd. The occupancy rate was down 15.9% compared to the same week in 2019.
----- Transit: Apple Mobility -----
This graph is from Apple mobility. From Apple: "This data is generated by counting the number of requests made to Apple Maps for directions in select countries/regions, sub-regions, and cities." This is just a general guide - people that regularly commute probably don't ask for directions.
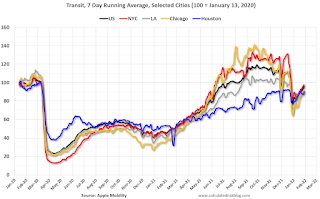 This data is through January 28th
----- New York City Subway Usage -----
Here is some interesting data on New York subway usage (HT BR).
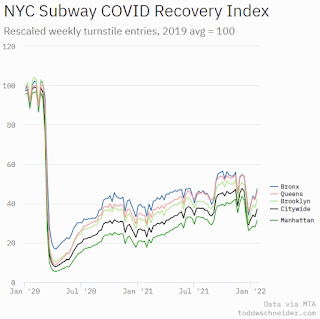 This graph is from Todd W Schneider.
This data is through Friday,January 28th.
He notes: "Data updates weekly from the MTA’s public turnstile data, usually on Saturday mornings".
Note: Gasoline consumption returned to pre-pandemic levels.
The TSA is providing daily travel numbers.
This data is as of January 30th.
Click on graph for larger image.This data shows the 7-day average of daily total traveler throughput from the TSA for 2019 (Light Blue), 2020 (Black), 2021 (Blue) and 2021 (Red).
The dashed line is the percent of 2019 for the seven-day average.
The 7-day average is down 23.4% from the same day in 2019 (76.6% of 2019). (Dashed line)
Air travel had been off about 20% relative to 2019 for most of the second half of 2021 (with some ups and downs) - but picked up over the Thanksgiving and Christmas holidays (solid leisure travel) - and has declined in early 2022 (omicron / weak business travel).
The second graph shows the 7-day average of the year-over-year change in diners as tabulated by OpenTable for the US and several selected cities.
IMPORTANT: OpenTable notes: "we’ve updated the data including downloadable dataset from January 1, 2021, onward to compare seated diners from 2021 to 2019, as opposed to year over year." Thanks!
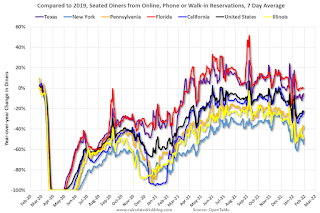 Thanks to OpenTable for providing this restaurant data:
This data is updated through January 29, 2022.
This data is "a sample of restaurants on the OpenTable network across all channels: online reservations, phone reservations, and walk-ins. For year-over-year comparisons by day, we compare to the same day of the week from the same week in the previous year."
Dining was mostly moving sideways, but there has been some decline recently, probably due to the winter wave of COVID. The 7-day average for the US is down 23% compared to 2019.
Thanks to OpenTable for providing this restaurant data:This data is updated through January 29, 2022.
This data is "a sample of restaurants on the OpenTable network across all channels: online reservations, phone reservations, and walk-ins. For year-over-year comparisons by day, we compare to the same day of the week from the same week in the previous year."
Dining was mostly moving sideways, but there has been some decline recently, probably due to the winter wave of COVID. The 7-day average for the US is down 23% compared to 2019.
This data shows domestic box office for each week and the median for the years 2016 through 2019 (dashed light blue). Black is 2020, Blue is 2021 and Red is 2022.
The data is from BoxOfficeMojo through January 27th.
Note that the data is usually noisy week-to-week and depends on when blockbusters are released.
Movie ticket sales were at $61 million last week, down about 69% from the median for the week.
Note that the data is usually noisy week-to-week and depends on when blockbusters are released.
Movie ticket sales were at $61 million last week, down about 69% from the median for the week.
This graph shows the seasonal pattern for the hotel occupancy rate using the four-week average. The red line is for 2022, black is 2020, blue is the median, and dashed light blue is for 2021.
This data is through January 22nd. The occupancy rate was down 15.9% compared to the same week in 2019.
The 4-week average of the occupancy rate is below the median rate for the previous 20 years (Blue).
Notes: Y-axis doesn't start at zero to better show the seasonal change.
Notes: Y-axis doesn't start at zero to better show the seasonal change.
The 4-week average of the occupancy rate will increase seasonally over the next few months. The key question is: How much business travel will return?
This graph is from Apple mobility. From Apple: "This data is generated by counting the number of requests made to Apple Maps for directions in select countries/regions, sub-regions, and cities." This is just a general guide - people that regularly commute probably don't ask for directions.
This data is through January 28th for the United States and several selected cities.
The graph is the running 7-day average to remove the impact of weekends.
IMPORTANT: All data is relative to January 13, 2020. This data is NOT Seasonally Adjusted. People walk and drive more when the weather is nice, so I'm just using the transit data.
According to the Apple data directions requests, public transit in the 7-day average for the US is at 96% of the January 2020 level.
Here is some interesting data on New York subway usage (HT BR).
This graph is from Todd W Schneider. This graph shows how much MTA traffic has recovered in each borough (Graph starts at first week in January 2020 and 100 = 2019 average).
Manhattan is at about 31% of normal.
This data is through Friday,January 28th.
He notes: "Data updates weekly from the MTA’s public turnstile data, usually on Saturday mornings".
Sunday, January 30, 2022
Sunday Night Futures
by Calculated Risk on 1/30/2022 08:28:00 PM
Weekend:
• Schedule for Week of January 30, 2022
Monday:
• At 9:45 AM ET, Chicago Purchasing Managers Index for January. The consensus is for a reading of 61.7, down from 64.3 in December.
• At 10:30 AM, Dallas Fed Survey of Manufacturing Activity for January. This is the last of the regional Fed manufacturing surveys for November.
• At 2:00 PM, Senior Loan Officer Opinion Survey on Bank Lending Practices for January.
From CNBC: Pre-Market Data and Bloomberg futures S&P 500 futures are down 15 and DOW futures are down 100 (fair value).
Oil prices were up over the last week with WTI futures at $86.82 per barrel and Brent at $90.03 per barrel. A year ago, WTI was at $52, and Brent was at $55 - so WTI oil prices are up about 65% year-over-year.
Here is a graph from Gasbuddy.com for nationwide gasoline prices. Nationally prices are at $3.35 per gallon. A year ago prices were at $2.41 per gallon, so gasoline prices are up $0.94 per gallon year-over-year.
Q4 2021 GDP Details on Residential and Commercial Real Estate
by Calculated Risk on 1/30/2022 12:37:00 PM
The BEA released the underlying details for the Q4 advance GDP report on Friday.
The BEA reported that investment in non-residential structures decreased at a 11.4% annual pace in Q4. Note that weakness in non-residential structures started in 2019, before the pandemic.
Investment in petroleum and natural gas structures increased sharply in Q4 compared to Q3 and was up 49% year-over-year.

The first graph shows investment in offices, malls and lodging as a percent of GDP.
Investment in offices (blue) increased slightly in Q4 and was up 2.9% year-over-year. (Still declining as a percent of GDP).
Investment in multimerchandise shopping structures (malls) peaked in 2007 and was up about 12% year-over-year in Q4 - from a very low level. The vacancy rate for malls is still very high, so investment will probably stay low for some time.
Lodging investment increased slightly in Q4 compared to Q3, and lodging investment was down 25% year-over-year.
All three sectors - offices, malls, and hotels - are being hurt significantly by the pandemic.
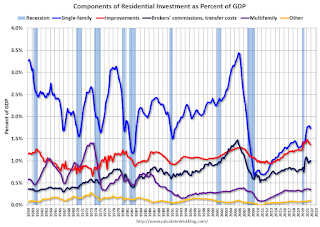 The second graph is for Residential investment components as a percent of GDP. According to the Bureau of Economic Analysis, RI includes new single-family structures, multifamily structures, home improvement, Brokers’ commissions and other ownership transfer costs, and a few minor categories (dormitories, manufactured homes).
Even though investment in single family structures has increased from the bottom, single family investment is just approaching normal levels as a percent of GDP.
Investment in single family structures was $416 billion (SAAR) (about 1.7% of GDP), and up 18% year-over-year.
Investment in multi-family structures decreased slightly in Q4.
Investment in home improvement was at a $328 billion Seasonally Adjusted Annual Rate (SAAR) in Q2 (about 1.4% of GDP). Home improvement spending has been strong during the pandemic.
The second graph is for Residential investment components as a percent of GDP. According to the Bureau of Economic Analysis, RI includes new single-family structures, multifamily structures, home improvement, Brokers’ commissions and other ownership transfer costs, and a few minor categories (dormitories, manufactured homes).Even though investment in single family structures has increased from the bottom, single family investment is just approaching normal levels as a percent of GDP.
Investment in single family structures was $416 billion (SAAR) (about 1.7% of GDP), and up 18% year-over-year.
Investment in multi-family structures decreased slightly in Q4.
Investment in home improvement was at a $328 billion Seasonally Adjusted Annual Rate (SAAR) in Q2 (about 1.4% of GDP). Home improvement spending has been strong during the pandemic.
Note that Brokers' commissions (black) increased sharply last year as existing home sales increased in the second half of 2020 but was down in Q2 and Q3. Brokers' commissions were up 3% year-over-year in Q4.
Saturday, January 29, 2022
Real Estate Newsletter Articles this Week
by Calculated Risk on 1/29/2022 02:11:00 PM
At the Calculated Risk Real Estate Newsletter this week:
• Final Look at Local Housing Markets in December No Signs of Slowing; Inventory at Record Lows
• Case-Shiller National Index up 18.8% Year-over-year in November FHFA: "House price levels remained elevated in November, but the data indicate a pivot"
• December New Home Sales: Inventory of homes under construction highest since 2007 New Home Sales increase to 811,000 Annual Rate in December; Sales down 7.3% in 2021
• Real House Prices, Price-to-Rent Ratio and Price-to-Median Income in NovemberAnd a look at "Affordability"
This is usually published several times a week, and provides more in-depth analysis of the housing market.
The blog will continue as always!
You can subscribe at https://calculatedrisk.substack.com/ Most content is available for free, but please subscribe!.
You can subscribe at https://calculatedrisk.substack.com/ Most content is available for free, but please subscribe!.
Schedule for Week of January 30, 2022
by Calculated Risk on 1/29/2022 08:11:00 AM
The key report scheduled for this week is the January employment report.
Other key indicators include January ISM manufacturing and services surveys, and January vehicle sales.
9:45 AM: Chicago Purchasing Managers Index for January. The consensus is for a reading of 61.7, down from 64.3 in December.
10:30 AM: Dallas Fed Survey of Manufacturing Activity for January. This is the last of the regional Fed manufacturing surveys for November.
2:00 PM: Senior Loan Officer Opinion Survey on Bank Lending Practices for January.
8:00 AM: Corelogic House Price index for December.
10:00 AM: Construction Spending for December. The consensus is for a 0.6% increase in construction spending.
 10:00 AM ET: Job Openings and Labor Turnover Survey for December from the BLS.
 This graph shows job openings (yellow line), hires (purple), Layoff, Discharges and other (red column), and Quits (light blue column) from the JOLTS.
Jobs openings decreased in November to 10.6 million from 11.1 million in October.
10:00 AM: ISM Manufacturing Index for January. The consensus is for the ISM to be at 57.5, down from 58.8 in December.
7:00 AM ET: The Mortgage Bankers Association (MBA) will release the results for the mortgage purchase applications index.
8:15 AM: The ADP Employment Report for January. This report is for private payrolls only (no government). The consensus is for 208,000 payroll jobs added in January, down from 807,000 added in December.
10:00 AM: the Q4 2021 Housing Vacancies and Homeownership from the Census Bureau.
8:30 AM: The initial weekly unemployment claims report will be released. The consensus is for a decrease to 250 thousand from 260 thousand last week.
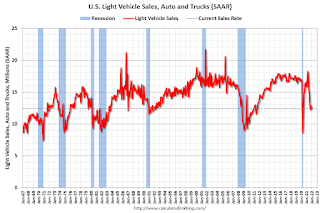 All day: Light vehicle sales for January. The consensus is for light vehicle sales to be 12.6 million SAAR in January, up from 12.4 million in December (Seasonally Adjusted Annual Rate).
This graph shows light vehicle sales since the BEA started keeping data in 1967. The dashed line is the December sales rate.
10:00 AM: the ISM Services Index for January.
 8:30 AM: Employment Report for January. The consensus is for 155 thousand jobs added, and for the unemployment rate to be unchanged at 3.9%. There were 199 thousand jobs added in December, and the unemployment rate was at 3.9%.
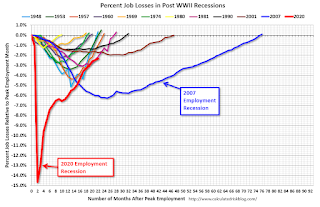
This graph shows the job losses from the start of the employment recession, in percentage terms.
The current employment recession was by far the worst recession since WWII in percentage terms. However, the current employment recession, 20 months after the onset, is now significantly better than the "Great Recession".


