by Calculated Risk on 11/16/2022 03:49:00 PM
Wednesday, November 16, 2022
3rd Look at Local Housing Markets in October; California Sales off 37% YoY, Prices Fall; Early Read on October Sales
Today, in the Calculated Risk Real Estate Newsletter: 3rd Look at Local Housing Markets in October; California Sales off 37% YoY, Prices Fall; Early Read on October Sales
A brief excerpt:
California doesn’t report monthly inventory numbers, but they do report the change in months of inventory. Here is the press release from the California Association of Realtors® (C.A.R.): California home sales bear brunt of higher interest rates in October, C.A.R. reportsThere is much more in the article. You can subscribe at https://calculatedrisk.substack.com/October’s sales pace was down 10.4 percent on a monthly basis from 305,680 in September and down 36.9 percent from a year ago, when 434,170 homes were sold on an annualized basis. ...
California’s median home price declined 2.5 percent in October to $801,190 from the $821,680 recorded in September. The October price was 0.3 percent higher than the $798,440 recorded last October and was the smallest year-over-year price gain in 29 months.In October, sales were down 29.2% YoY Not Seasonally Adjusted (NSA) for these markets.
Here is a table comparing the year-over-year Not Seasonally Adjusted (NSA) declines in sales this year from the National Association of Realtors® (NAR) with the local markets I track. So far, these measures have tracked closely, and the preliminary data below suggests a sharp decline in sales in October.
AIA: Architecture Billings Index "decreases considerably" in October
by Calculated Risk on 11/16/2022 12:02:00 PM
Note: This index is a leading indicator primarily for new Commercial Real Estate (CRE) investment.
From the AIA: Demand for design services decreases considerably
Demand for design services from architecture firms softened considerably in October, according to a new report from The American Institute of Architects (AIA).
AIA’s Architecture Billings Index (ABI) score for October was 47.7, the first decline in billings since January 2021 (any score below 50 indicates a decline in firm billings). Inquiries into new projects continued to grow in October with a score of 52.3, while the value of new design contracts declined, with a score of 48.6.
“Economic headwinds have been steadily mounting, and finally led to weakening demand for new projects,” said AIA Chief Economist, Kermit Baker, Hon. AIA, PhD. “Firm backlogs are healthy and will hopefully provide healthy levels of design activity against fewer new projects entering the pipeline should this weakness persist.”
...
• Regional averages: Midwest (50.8); South (50.6); Northeast (50.3); West (49.6)
• Sector index breakdown: institutional (54.3); mixed practice (50.8); multi-family residential (46.1); commercial/industrial (45.9)
emphasis added
 Click on graph for larger image.
This graph shows the Architecture Billings Index since 1996. The index was at 47.7 in October, down from 51.7 in September. Anything below 50 indicates contraction in demand for architects' services.
Note: This includes commercial and industrial facilities like hotels and office buildings, multi-family residential, as well as schools, hospitals and other institutions.
This index had been positive for 20 consecutive months. This index usually leads CRE investment by 9 to 12 months, so this index suggests a pickup in CRE investment in early 2023, but if the weakness persists - a slowdown in CRE investment later in 2023.
NAHB: Builder Confidence Decreased Further in November
by Calculated Risk on 11/16/2022 10:07:00 AM
The National Association of Home Builders (NAHB) reported the housing market index (HMI) was at 33, down from 35 last month. Any number below 50 indicates that more builders view sales conditions as poor than good.
From the NAHB: Builder Confidence Declines for 11 Consecutive Months as Housing Weakness Continues
Elevated interest rates, stubbornly high building material costs and declining affordability conditions that are pushing more buyers to the sidelines continue to drag down builder sentiment.
Builder confidence in the market for newly built single-family homes posted its 11th straight monthly decline in November, dropping five points to 33, according to the National Association of Home Builders (NAHB)/Wells Fargo Housing Market Index (HMI) released today. This is the lowest confidence reading since June 2012, with the exception of the onset of the pandemic in the spring of 2020.
“Higher interest rates have significantly weakened demand for new homes as buyer traffic is becoming increasingly scarce,” said NAHB Chairman Jerry Konter, a home builder and developer from Savannah, Ga. “With the housing sector in a recession, the Biden administration and new Congress must turn their focus to policies that lower the cost of building and allow the nation’s home builders to expand housing production.”
To bring more buyers into the marketplace, 59% of builders report using incentives, with a big increase in usage from September to November. For example, in November, 25% of builders say they are paying points for buyers, up from 13% in September. Mortgage rate buy-downs rose from 19% to 27% over the same time frame. And 37% of builders cut prices in November, up from 26% in September, with an average price of reduction of 6%. This is still far below the 10%-12% price cuts seen during the Great Recession in 2008.”
...
All three HMI components posted declines in November. Current sales conditions fell six points to 39, sales expectations in the next six months declined four points to 31 and traffic of prospective buyers fell five points to 20.
Looking at the three-month moving averages for regional HMI scores, the Northeast fell six points to 41, the Midwest dropped two points to 38, the South fell seven points to 42 and the West posted a five-point decline to 29
emphasis added
 Click on graph for larger image.
This graph shows the NAHB index since Jan 1985.
This was below the consensus forecast, and the lowest level since 2012 (excluding the two-month drop at the beginning of the pandemic).
Industrial Production Decreased 0.1 Percent in October
by Calculated Risk on 11/16/2022 09:21:00 AM
From the Fed: Industrial Production and Capacity Utilization
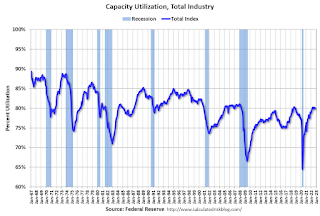
Industrial production decreased 0.1 percent in October, and its gain in September was revised down to 0.1 percent. Manufacturing output edged up 0.1 percent in October, and its increases in July, August, and September were all lower than previously reported. In October, the index for mining stepped down 0.4 percent, and the index for utilities fell 1.5 percent. At 104.7 percent of its 2017 average, total industrial production in October was 3.3 percent above its year-earlier reading. Capacity utilization decreased 0.2 percentage point in October to 79.9 percent, a rate that is 0.3 percentage point above its long-run (1972–2021) average.
emphasis added
 Click on graph for larger image.
This graph shows Capacity Utilization. This series is up from the record low set in April 2020, and above the level in February 2020 (pre-pandemic).
Capacity utilization at 79.9% is 0.3% above the average from 1972 to 2021. This was below consensus expectations.
Note: y-axis doesn't start at zero to better show the change.
 The second graph shows industrial production since 1967.
Industrial production decreased in October to 104.7. This is above the pre-pandemic level.
The change in industrial production was below consensus expectations.
Retail Sales Increased 1.3% in October
by Calculated Risk on 11/16/2022 08:39:00 AM
On a monthly basis, retail sales were up 1.3% from September to October (seasonally adjusted), and sales were up 8.3 percent from October 2021.
From the Census Bureau report:
Advance estimates of U.S. retail and food services sales for October 2022, adjusted for seasonal variation and holiday and trading-day differences, but not for price changes, were $694.5 billion, up 1.3 percent from the previous month, and 8.3 percent above October 2021. ... The August 2022 to September 2022 percent change was unrevised from virtually unchanged.
emphasis added
 Click on graph for larger image.
This graph shows retail sales since 1992. This is monthly retail sales and food service, seasonally adjusted (total and ex-gasoline).
Retail sales ex-gasoline were up 1.0% in October.
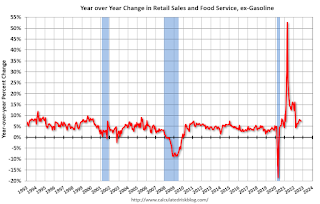
The second graph shows the year-over-year change in retail sales and food service (ex-gasoline) since 1993.
Retail and Food service sales, ex-gasoline, increased by 7.4% on a YoY basis.
 Sales in October were above expectations, however sales in August and September were revised up, combined.
MBA: Mortgage Applications Increase in Latest Weekly Survey
by Calculated Risk on 11/16/2022 07:00:00 AM
From the MBA: Mortgage Applications Increase in Latest MBA Weekly Survey
Mortgage applications increased 2.7 percent from one week earlier, according to data from the Mortgage Bankers Association’s (MBA) Weekly Mortgage Applications Survey for the week ending November 11, 2022. This week’s results include an adjustment for the observance of Veterans Day.
... The Refinance Index decreased 2 percent from the previous week and was 88 percent lower than the same week one year ago. The seasonally adjusted Purchase Index increased 4 percent from one week earlier. The unadjusted Purchase Index decreased 10 percent compared with the previous week and was 46 percent lower than the same week one year ago.
“Mortgage rates decreased last week as signs of slower inflation pushed Treasury yields lower. The 30- year fixed rate saw the largest single-week decline since July 2022, dropping to 6.9 percent,” said Joel Kan, MBA’s Vice President and Deputy Chief Economist. “Application activity, adjusted to account for the Veterans Day holiday, increased in response to the drop in rates – driven by a 4 percent rise in home purchase applications. Purchase applications increased for all loan types, and the average purchase loan dipped to its smallest amount since January 2021. Refinance activity remained depressed, down 88 percent over the year. There is very little refinance incentive with rates so much higher than last year.”
...
The average contract interest rate for 30-year fixed-rate mortgages with conforming loan balances ($647,200 or less) decreased to 6.90 percent from 7.14 percent, with points decreasing to 0.56 from 0.77 (including the origination fee) for 80 percent loan-to-value ratio (LTV) loans
emphasis added
 Click on graph for larger image.
The first graph shows the refinance index since 1990.
Note: Red is a four-week average (blue is weekly).
Tuesday, November 15, 2022
Wednesday: Retail Sales, Industrial Production, Homebuilder Survey
by Calculated Risk on 11/15/2022 08:08:00 PM

Wednesday:
• At 7:00 AM ET, The Mortgage Bankers Association (MBA) will release the results for the mortgage purchase applications index.
• At 8:30 AM, Retail sales for October will be released. The consensus is for a 0.9% increase in retail sales.
• At 9:15 AM, The Fed will release Industrial Production and Capacity Utilization for October. The consensus is for a 0.2% increase in Industrial Production, and for Capacity Utilization to increase to 80.4%.
• At 10:00 AM, The November NAHB homebuilder survey. The consensus is for a reading of 36, down from 38. Any number below 50 indicates that more builders view sales conditions as poor than good.
• During the day: The AIA's Architecture Billings Index for October (a leading indicator for commercial real estate).
Inflation: Comparing to 1980, and Core CPI ex-Shelter
by Calculated Risk on 11/15/2022 03:47:00 PM
Earlier this year I wrote: Housing: Don't Compare the Current Housing Boom to the Bubble and Bust. I argued the 1978 to 1982 period was a more similar period for housing.
One of the graphs I presented was of year-over-year inflation.

This graph shows the year-over-year change in inflation since 1959.
Also note that recessions usually follow spikes in inflation as the Fed raises rates.
Although not a perfect comparison, I think the 1978 to 1982 is better than comparing to the housing bubble period with all the loose lending.
The second graph shows the year-over-year change in Core CPI ex-Shelter (blue), and the one month change annualized (red).

I think this is important since there is growing evidence that rents are falling (more than seasonally). This is likely due to the sharp slowdown in household formation (since household formation surged during the pandemic, partially related to work-from-home), and will likely continue with the record number of housing units under construction.
NY Fed Q3 Report: Household Debt Increases, Delinquencies "very low"
by Calculated Risk on 11/15/2022 11:15:00 AM
From the NY Fed: Total Household Debt Reaches $16.51 trillion in Q3 2022; Mortgage and Auto Loan Originations Decline
The Federal Reserve Bank of New York's Center for Microeconomic Data today issued its Quarterly Report on Household Debt and Credit. The Report shows an increase in total household debt in the third quarter of 2022, increasing by $351 billion (2.2%) to $16.51 trillion. Balances now stand $2.36 trillion higher than at the end of 2019, before the pandemic recession. The report is based on data from the New York Fed's nationally representative Consumer Credit Panel.
Mortgage balances rose by $282 billion in the third quarter of 2022 and stood at $11.67 trillion at the end of September, representing a $1 trillion increase from the previous year. Credit card balances also increased by $38 billion. The 15% year-over-year increase in credit card balances represents the largest in more than 20 years. Auto loan balances increased by $22 billion in the third quarter, consistent with the upward trajectory seen since 2011. Student loan balances slightly declined and now stand at $1.57 trillion. In total, non-housing balances grew by $66 billion.
Mortgage originations, which include refinances, stood at $633 billion in the third quarter, representing a $126 billion decline from the second quarter and a return to pre-pandemic volumes. The volume of newly originated auto loans was $185 billion, a slight reduction from the previous quarter but still elevated compared to the average volumes seen through the 2018-2019 period. Aggregate limits on credit card accounts increased by $82 billion and now stand at $4.3 trillion.
"Credit card, mortgage, and auto loan balances continued to increase in the third quarter of 2022 reflecting a combination of robust consumer demand and higher prices," said Donghoon Lee, Economic Research Advisor at the New York Fed. "However, new mortgage originations have slowed to pre-pandemic levels amid rising interest rates."
emphasis added
 Click on graph for larger image.
Here are three graphs from the report:
The first graph shows aggregate consumer debt increased in Q3. Household debt previously peaked in 2008 and bottomed in Q3 2013. Unlike following the great recession, there wasn't a huge decline in debt during the pandemic.
From the NY Fed:
Aggregate household debt balances increased by $351 billion in the third quarter of 2022, a 2.2% rise from 2022Q2. Balances now stand at $16.51 trillion and have increased by $2.36 trillion since the end of 2019, just before the pandemic recession.
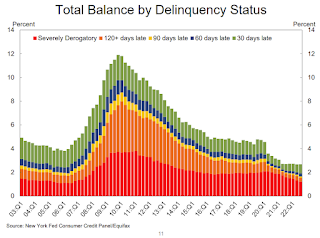
 The second graph shows the percent of debt in delinquency.
The overall delinquency rate was unchanged in Q3. From the NY Fed:
Aggregate delinquency rates were unchanged in the third quarter of 2022 and remained very low, after declining sharply through the beginning of the pandemic. As of September, 2.7% of outstanding debt was in some stage of delinquency, a 2.1 percentage point decrease from the last quarter of 2019, just before the COVID-19 pandemic hit the United States
 The third graph shows Mortgage Originations by Credit Score.
From the NY Fed:
Mortgage originations, measured as appearances of new mortgages on consumer credit reports, declined to $633 billion in 2022Q3, ending the period of high volumes of origination through the pandemic. ... The median credit score of newly originated mortgages declined again, to 768, down from a series high in 2021Q1 of 788 and returning to pre-covid levels which remain very high and reflect continuing high lending standards.There is much more in the report.
Lawler: Are US Rents Falling?
by Calculated Risk on 11/15/2022 09:42:00 AM
Today, in the Calculated Risk Real Estate Newsletter: Lawler: Are US Rents Falling?
A brief excerpt:
After increasing at a pace unseen in US history from the Spring of 2021 to the middle of 2022, it appears as if US rent growth has slowed sharply over the past few months. Indeed, the most “high frequency” data (meaning most timely) suggest that US rents may have stopped increasing this Fall, and may actually have begun to decline.There is much more in the article. You can subscribe at https://calculatedrisk.substack.com/
...
Below is a table showing the monthly % changes in these rent indexes NOT adjusted for seasonal fluctuations.
CR Note: The CoreLogic index was negative in September (released this morning).
Note that the Apartment List Index, which is not smoothed, has shown two consecutive monthly declines, while the Zillow Index, which IS smoothed, fell for the [first] time in over two years last month. Note also that the CoreLogic Index, available only through August and which is smoothed, decelerated sharply during “August.”
The above table can be a bit misleading, however, because all three rent indexes display relatively modest but statistically significant seasonal fluctuations ...
While none of these rent indexes is perfect, the latest data suggest that US rent growth has slowed sharply in recent months, and at best has been growing in the low single digits and quite possibly may have actually turned slightly negative last month. If so, that is certainly no surprise, and as I said in an earlier report, I expect that US rents in 2023 will be lower than rents during this Summer and Fall.


