 RSS Feed
 by Calculated Risk on 1/02/2023 01:47:00 PM
Monday, January 02, 2023
Question #9 for 2023: What will happen with house prices in 2023?
Today, in the Real Estate Newsletter: Question #9 for 2023: What will happen with house prices in 2023?
A brief excerpt:
Earlier I posted some questions on my blog for next year: Ten Economic Questions for 2023. Some of these questions concern real estate (inventory, house prices, housing starts, new home sales), and I’ll post thoughts on those in the newsletter (others like GDP and employment will be on my blog).There is much more in the article. You can subscribe at https://calculatedrisk.substack.com/
I'm adding some thoughts, and maybe some predictions for each question.
9) House Prices: It appears house prices - as measured by the national repeat sales index (Case-Shiller, FHFA, and CoreLogic) - will be up around 7% in 2022. What will happen with house prices in 2023?
The first question I’m always asked is what “Will happen with house prices?”. No one has a crystal ball, but it does appear house prices will decline in 2023.
...
The following graph - as of the NAR release last month - shows that Case-Shiller followed the median prices up and is now following the deceleration in median prices down. It is likely the median price will be down year-over-year in a few months - and Case-Shiller will follow.
Note: Median prices are distorted by the mix (repeat sales indexes like Case-Shiller and FHFA are probably better for measuring prices).

Housing January 2nd Weekly Update: Inventory Decreased 3.4% Week-over-week
by Calculated Risk on 1/02/2023 09:16:00 AM
Altos reports inventory is down 3.4% week-over-week and down 15.0% from the peak on October 28, 2022.
 Click on graph for larger image.
This inventory graph is courtesy of Altos Research.
As of December 30th, inventory was at 491 thousand (7-day average), compared to 508 thousand the prior week. Inventory has declined sharply over the holidays.

The red line is for 2022. The black line is for 2019.
Inventory was at a record low in early 2022 and was up compared to the same week in 2021 as of May 20, 2022.
Inventory was up compared to the same week in 2020 as of October 7, 2022, however, inventory will start well below 2020 levels in early 2023.
Currently inventory is up 67.3% year-over-year, and down 35.7% compared to 2019.
A key will when inventory starts increasing in 2023 (the bottom is usually in February of each year).
Mike Simonsen discusses this data regularly on Youtube.
Sunday, January 01, 2023
Reis: Office Vacancy Rate Increased in Q4 as "demand plummeted", Mall Vacancy Rate Unchanged
by Calculated Risk on 1/01/2023 09:56:00 AM
From Moody’s Analytics Senior Economist Lu Chen and economist Xiaodi Li: Apartment struck a balance, Office demand plummeted, and Retail remains flat
Corporate profits squeezed under macroeconomic uncertainties and flexible work arrangements weakened office demand and continued to transform the sector’s fundamental. Moreover, new office demand isn’t always reflected through direct leases. As office downsizing became more commonplace, sublet space inevitably followed to absorb new demand. Net absorption plummeted from over 3 million square feet (sqft) in Q3 to -7.13 million sqft in Q4.
Affected by the overall office sector sentiment, new delivery dwindled to slightly above 2 million sqft nationwide, the lowest quarterly delivery in our more than 20 years of tracking history. Vacancy climbed for the fourth straight quarter to 18.7%, 20 bps higher than the previous quarter or 60 bps higher than the same time last year. Compared to Q3, asking rent in Q4 increased by 0.3% (from $35.05 to $35.14), and effective rent edged up 0.1% (from $28.00 to $28.04).
emphasis added
Reis reported the office vacancy rate was at 18.7% in Q4 2022, up from 18.5% in Q3, and up from 18.1% in Q4 2021.
This was the highest vacancy rate for offices since 1992 (following the S&L crisis).
NOTE: This says nothing about how many people are in the offices (related to the increase in work-from-home), just whether or not the office space is leased.
 Click on graph for larger image.
This graph shows the office vacancy rate starting in 1980 (prior to 1999 the data is annual).
The office vacancy rate was elevated prior to the pandemic and moved up during the pandemic.
Reis also reported that office effective rents increased 0.1% in Q4; rents are about at the same level as before the pandemic.
And from Reis on Retail:
Bolstered by consumer spending, neighborhood and community shopping center net absorption was up 44% in Q4 as compared to last quarter. New construction delivery fell under 600,000 sqft and caused the inventory to grow just above 3 million sqft for the year, less than half of 2019’s record. Given the relative balance between supply and demand, national vacancy for neighborhood and community shopping centers stayed flat at 10.3% for the fifth straight quarter. Asking/effective rents were up slightly by 0.2%/0.2% in Q4 and remained in the $21/$18-per-sqft range, a level unchanged since 2018. Regional mall properties, on the other hand, continue to be the most at-risk retail subtype according to our commercial mortgage delinquency data, driving overall delinquency behavior among retail assets. Regional and super regional malls’ vacancy ticked up 10 bps to 11.2%, identical to the same time last year.
Reis reported that the vacancy rate for regional malls was 11.2% in Q4 2022, up from 11.1% in Q2 2021, and unchanged from 11.2% in Q4 2021. The regional mall vacancy rate peaked at 11.5% in Q2 2021.
For Neighborhood and Community malls (strip malls), the vacancy rate was 10.3% in Q4, unchanged from 10.3% in Q3, and unchanged from 10.3% in Q4 2021. For strip malls, the vacancy rate peaked during the pandemic at 10.6% in both Q1 and Q2 2021.
 This graph shows the strip mall vacancy rate starting in 1980 (prior to 2000 the data is annual). The regional mall data starts in 2000. Back in the '80s, there was overbuilding in the mall sector even as the vacancy rate was rising. This was due to the very loose commercial lending that led to the S&L crisis.
 In the mid-'00s, mall investment picked up as mall builders followed the "roof tops" of the residential boom (more loose lending). This led to the vacancy rate moving higher even before the recession started. Then there was a sharp increase in the vacancy rate during the recession and financial crisis.
In the last several years, even prior to the pandemic, the regional mall vacancy rates increased significantly from an already elevated level.
Effective rents have been mostly unchanged for regional malls over the last 4+ years, and flat for strip malls for 3+ years.
All vacancy data courtesy of Moody’s Analytics Reis
Q4 2022 Update: Unofficial Problem Bank list Decreased to 49 Institutions; Search for "Whale" Continues
by Calculated Risk on 1/01/2023 09:01:00 AM
The FDIC's official problem bank list is comprised of banks with a CAMELS rating of 4 or 5, and the list is not made public (just the number of banks and assets every quarter). Note: Bank CAMELS ratings are also not made public.
CAMELS is the FDIC rating system, and stands for Capital adequacy, Asset quality, Management, Earnings, Liquidity and Sensitivity to market risk. The scale is from 1 to 5, with 1 being the strongest.
As a substitute for the CAMELS ratings, surferdude808 is using publicly announced formal enforcement actions, and also media reports and company announcements that suggest to us an enforcement action is likely, to compile a list of possible problem banks in the public interest.
DISCLAIMER: This is an unofficial list, the information is from public sources only, and while deemed to be reliable is not guaranteed. No warranty or representation, expressed or implied, is made as to the accuracy of the information contained herein and same is subject to errors and omissions. This is not intended as investment advice. Please contact CR with any errors.
NOTE: I'm no longer updating the spreadsheet.
Here are the quarterly changes and a few comments from surferdude808:
Regulators still haven't disclosed the "whale" (that added close to $120 billion to problem assets).
Here are the quarterly changes and a few comments from surferdude808:
Update on the Unofficial Problem Bank List through December, 2022. Since the last update at the end of September 2022, the list decreased by two to 49 institutions after four additions and six removals. Assets decreased by $401 million to $51.1 billion, with the change primarily resulting from a $1.3 billion decrease from updated asset figures through September 30, 2021. A year ago, the list held 57 institutions with assets of $56.6 billion. Added during the fourth quarter of 2022 was Union County Savings Bank, Elizabeth, NJ ($1.8 billion); Union State Bank, Pell City, AL ($266 million); Citizens Savings Bank and Trust Company, Nashville, TN ($140 million); and Wabash Savings Bank, Mount Carmel, IL ($9.8 million). Removals during the quarter because of action termination included Quontic Bank, New York, NY ($793 million); Cecil Bank, Elkton, MD ($243 million); Neighborhood National Bank, San Diego, CA ($119 million); The First National Bank of Hope, Hope, KS ($82 million); and Home Bank of Arkansas, Portland, AR ($65 million). Ashton State Bank, Ashton, NE ($20 million) found their way off this list through a voluntary merger.
With the conclusion of the fourth quarter, we bring an updated transition matrix to detail how banks are transitioning off the Unofficial Problem Bank List. Since we first published the Unofficial Problem Bank List on August 7, 2009 with 389 institutions, 1,789 institutions have appeared on a weekly or monthly list since then. Only 2.7 percent of the banks that have appeared on a list remain today as 1,740 institutions have transitioned through the list. Departure methods include 1,029 action terminations, 411 failures, 281 mergers, and 19 voluntary liquidations. Of the 389 institutions on the first published list, only 3 or less than 1.0 percent, still have a troubled designation more than ten years later. The 411 failures represent 23 percent of the 1,789 institutions that have made an appearance on the list. This failure rate is well above the 10-12 percent rate frequently cited in media reports on the failure rate of banks on the FDIC's official list.
On December 1, 2022, the FDIC released third quarter results and provided an update on the Official Problem Bank List. While FDIC did not make a comment within its press release on the Official Problem Bank List, they provided details in an attachment that listed 42 institutions with assets of $164 billion. In its 2022 first quarter release, the FDIC list had a material $119 billion increase in assets. Since that release, none of the prudential banking regulators – FDIC, Federal Reserve, and OCC – have publicly released an enforcement action detailing an enforcement action against a large institution. The Financial Institutions Reform, Recovery and Enforcement Act (FIRREA) passed by Congress in 1989 requires publication of enforcement actions. See “Supervisory Enforcement Actions Since FIRREA and FDICIA,” published by the Federal reserve Bank of Minneapolis for further details. Prior to FIRREA, enforcement actions were not published by the prudential banking regulators. Section 913 of FIRREA requires public disclosures of enforcement actions. Section 913(2) does allow a delay in the enforcement action publication if “exceptional circumstances” exist. The prudential regulator must make a written determination that publication “would seriously threaten the safety & soundness of an insured depository institution.” The prudential regulator “may delay the publication of such order for a reasonable time.” The section does not define “a reasonable time.” It has been more than six months since that enforcement action was issued, so it seems the primary regulator considers this a “reasonable time” before it informs the public of a large troubled institution.
Saturday, December 31, 2022
Real Estate Newsletter Articles this Week: Houses are the least “affordable” since 1982
by Calculated Risk on 12/31/2022 02:11:00 PM
At the Calculated Risk Real Estate Newsletter this week:
• Case-Shiller: National House Price Index "Continued to Decline" to 9.2% year-over-year increase in October
• Final Look at Local Housing Markets in November
• Inflation Adjusted House Prices 3.8% Below Peak. Houses are the least “affordable” since 1982 when 30-year mortgage rates were over 14%
• Question #10 for 2023: Will inventory increase further in 2023?
This is usually published 4 to 6 times a week and provides more in-depth analysis of the housing market.
You can subscribe at https://calculatedrisk.substack.com/
Most content is available for free (and no Ads), but please subscribe!
Schedule for Week of January 1, 2023
by Calculated Risk on 12/31/2022 08:11:00 AM
Happy New Year! Wishing you all the best in 2023.
The key report this week is the December employment report on Friday.
Other key indicators include the December ISM manufacturing, December vehicle sales, the November trade deficit, and November Job Openings.
The NYSE and the NASDAQ will be closed in observance of the New Year’s Day holiday
8:00 AM ET: Corelogic House Price index for November.
10:00 AM: Construction Spending for November. The consensus is for a 0.4% decrease in construction spending.
7:00 AM ET: The Mortgage Bankers Association (MBA) will release the results for the mortgage purchase applications index.
 10:00 AM ET: Job Openings and Labor Turnover Survey for October from the BLS.
 This graph shows job openings (black line), hires (dark blue), Layoff, Discharges and other (red column), and Quits (light blue column) from the JOLTS.
Jobs openings decreased in October to 10.334 million from 10.687 million in September
10:00 AM: ISM Manufacturing Index for December. The consensus is for the ISM to be at 48.5, down from 49.0 in November.
2:00 PM: FOMC Minutes, Meeting of December 13-14, 2022
 All day: Light vehicle sales for December.
The Wards forecast is for 13.0 million SAAR in December, down from the BEA estimate of 14.1 million SAAR in November (Seasonally Adjusted Annual Rate).
This graph shows light vehicle sales since the BEA started keeping data in 1967. The dashed line is the current sales rate.
8:15 AM: The ADP Employment Report for December. This report is for private payrolls only (no government). The consensus is for 145,000, up from 127,000 jobs added in November.
 8:30 AM: Trade Balance report for November from the Census Bureau.
 This graph shows the U.S. trade deficit, with and without petroleum, through the most recent report. The blue line is the total deficit, and the black line is the petroleum deficit, and the red line is the trade deficit ex-petroleum products.
The consensus is the trade deficit to be $76.1 billion. The U.S. trade deficit was at $78.2 billion in October.
8:30 AM: The initial weekly unemployment claims report will be released. The consensus is for 230 thousand initial claims, up from 225 thousand last week.
 8:30 AM: Employment Report for November. The consensus is for 200,000 jobs added, and for the unemployment rate to be unchanged at 3.7%.
There were 263,000 jobs added in November, and the unemployment rate was at 3.7%.
This graph shows the job losses from the start of the employment recession, in percentage terms.
The current employment recession was by far the worst recession since WWII in percentage terms. However, as of August 2022, the total number of jobs had returned and are now 1.044 million above pre-pandemic levels.
10:00 AM: the ISM Services Index for December.
Friday, December 30, 2022
COVID Dec 30, 2022: Update on Cases, Hospitalizations and Deaths
by Calculated Risk on 12/30/2022 08:46:00 PM
On COVID (focus on hospitalizations and deaths). Data is now weekly.
| COVID Metrics | ||||
|---|---|---|---|---|
| Now | Week Ago | Goal | ||
| New Cases per Week2 | 402,525 | 486,627 | ≤35,0001 | |
| Hospitalized2🚩 | 34,116 | 33,788 | ≤3,0001 | |
| Deaths per Week2 | 2,530 | 2,932 | ≤3501 | |
| 1my goals to stop weekly posts, 2Weekly for Cases, Currently Hospitalized, and Deaths 🚩 Increasing number weekly for Cases, Hospitalized, and Deaths ✅ Goal met. | ||||
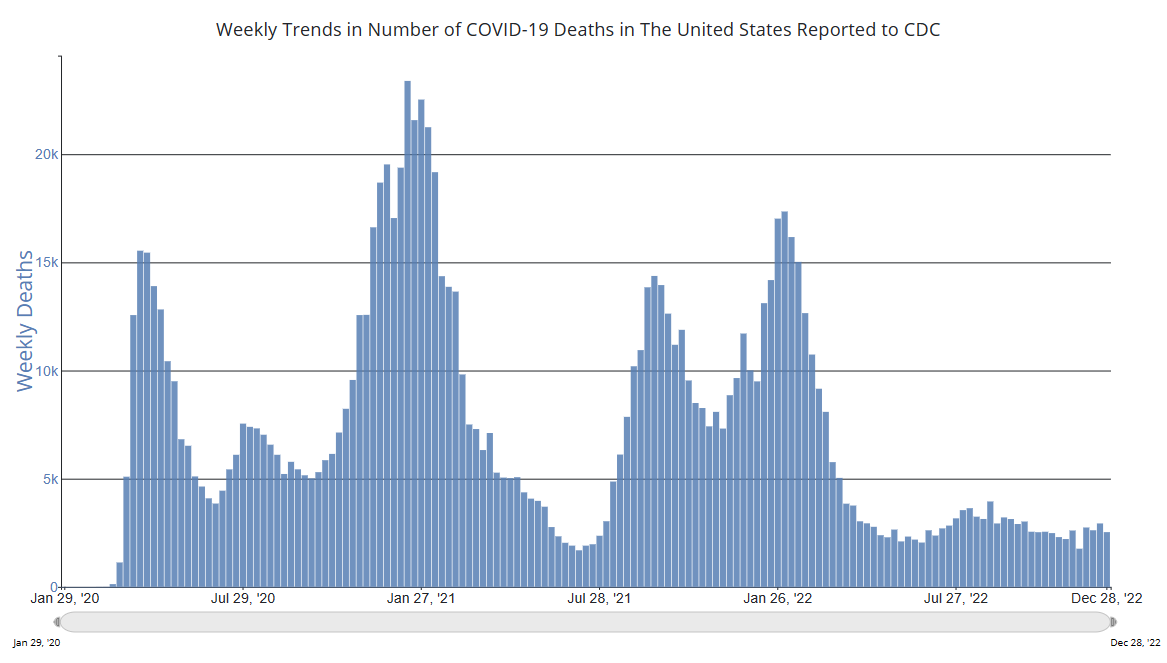 Click on graph for larger image.
This graph shows the weekly (columns) number of deaths reported.
January was the worst month for the previous two years, and hopefully this January will not see a significant wave.
Realtor.com Reports Weekly Active Inventory Up 63% YoY; New Listings Down 6% YoY
by Calculated Risk on 12/30/2022 03:06:00 PM
Realtor.com has monthly and weekly data on the existing home market.
For the week ending December 24th, active inventory was up 63.1% year-over-year (YoY), up from 58.1% YoY last week.
New listings were down 5.7% YoY, the smallest YoY decrease since July. This small YoY decrease in new listings might be related to the holidays.
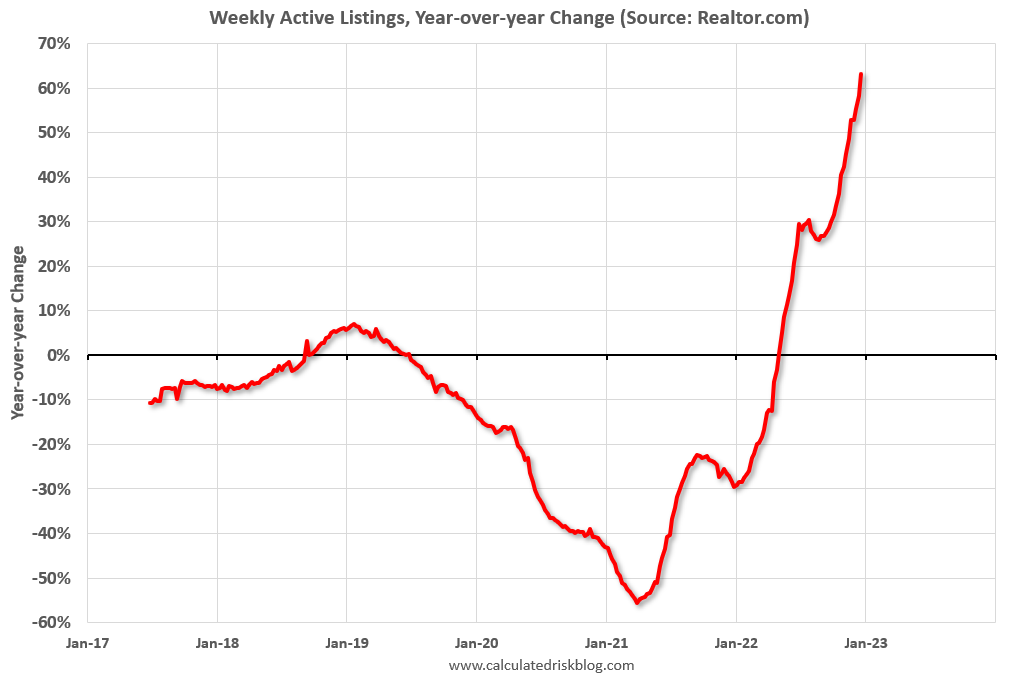 Here is a graph of the year-over-year change in inventory according to realtor.com.
Last year, inventory was at record lows during the Winter. So, it is no surprise that YoY inventory measures are still increasing.
The key will be what happens during the busy new listing season (usually March through July).
Note: inventory is falling seasonally week-to-week now, but the comparison is YoY.
Question #10 for 2023: Will inventory increase further in 2023?
by Calculated Risk on 12/30/2022 09:35:00 AM
Today, in the Real Estate Newsletter: Question #10 for 2023: Will inventory increase further in 2023?
Brief excerpt:
Earlier I posted some questions on my blog for next year: Ten Economic Questions for 2023. Some of these questions concern real estate (inventory, house prices, housing starts, new home sales), and I’ll post thoughts on those in the newsletter (others like GDP and employment will be on my blog).There is much more in the article. You can subscribe at https://calculatedrisk.substack.com/
I'm adding some thoughts, and maybe some predictions for each question.
10) Housing Inventory: Housing inventory decreased sharply during the pandemic to record lows in early 2022. Since then, inventory has increased, but is still well below pre-pandemic levels. Will inventory increase further in 2023?
...
First, a brief history. Here are a few times when watching existing home inventory helped my analysis.
Starting in January 2005, I was very bearish on housing, but I wasn’t sure when the market would turn. Speculative bubbles can go on and on. However, the increase in inventory in late 2005 (see red arrow on graph) helped me call the top for house prices in 2006.Several years later, in early 2012, when many people were still bearish on housing, the plunge in inventory in 2011 (blue arrow on graph below) helped me call the bottom for house prices in early 2012 (see The Housing Bottom is Here).
...
It seems likely that mortgage rates will remain well above the pandemic lows, and therefore new listings will be depressed again in 2023.
The bottom line is inventory will probably increase year-over-year in 2023. However, with the dearth of new listings, it still seems unlikely - but not impossible - that inventory will be back up to the 2017 - 2019 levels. Inventory is always something to watch!

A few comments on the Seasonal Pattern for House Prices
by Calculated Risk on 12/30/2022 08:18:00 AM
Two key points:
1) There is a clear seasonal pattern for house prices.
2) The surge in distressed sales during the housing bust distorted the seasonal pattern.
For in depth description of these issues, see Jed Kolko's article from 2014 "Let’s Improve, Not Ignore, Seasonal Adjustment of Housing Data"
Note: I was one of several people to question the change in the seasonal factor (here is a post in 2009) - and this led to S&P Case-Shiller questioning the seasonal factor too (from April 2010). I still use the seasonal factor (I think it is better than using the NSA data).
 Click on graph for larger image.
This graph shows the month-to-month change in the NSA Case-Shiller National index since 1987 (through October 2022). The seasonal pattern was smaller back in the '90s and early '00s and increased once the bubble burst.
The seasonal swings declined following the bust, however the recent price surge changed the month-over-month pattern.
 The second graph shows the seasonal factors for the Case-Shiller National index since 1987. The factors started to change near the peak of the bubble, and really increased during the bust since normal sales followed the regular seasonal pattern - and distressed sales happened all year.
The swings in the seasonal factors have decreased, and the seasonal factors had been moving back towards more normal levels.
Note that the recent price surge hasn't distorted the seasonal factors. Unless there is a wave of distressed sales (unlikely due to mostly solid lending), the seasonal pattern won't be distorted like during the housing bust.


