 RSS Feed
 by Calculated Risk on 1/04/2023 07:00:00 AM
Wednesday, January 04, 2023
MBA: Mortgage Applications Decreased Over Last Two Weeks
From the MBA: Mortgage Applications Decreased Over a Two-Week Period in Latest
MBA Weekly Survey
Mortgage applications decreased 13.2 percent from two weeks earlier, according to data from the Mortgage Bankers Association’s (MBA) Weekly Mortgage Applications Survey for the week ending December 30, 2022. The results include adjustments to account for the holidays.
... The holiday adjusted Refinance Index decreased 16.3 percent from the two weeks ago and was 87 percent lower than the same week one year ago. The seasonally adjusted Purchase Index decreased 12.2 percent from two weeks earlier. The unadjusted Purchase Index decreased 38.5 percent compared with the two weeks ago and was 42 percent lower than the same week one year ago.
“The end of the year is typically a slower time for the housing market, and with mortgage rates still well above 6 percent and the threat of a recession looming, mortgage applications continued to decline over the past two weeks to the lowest level since 1996,” said Joel Kan, MBA’s Vice President and Deputy Chief Economist. “Purchase applications have been impacted by slowing home sales in both the new and existing segments of the market. Even as home-price growth slows in many parts of the country, elevated mortgage rates continue to put a strain on affordability and are keeping prospective homebuyers out of the market.”
Added Kan, “Refinance applications remain less than a third of the market and were 87 percent lower than a year ago as rates remained close to double what they were in 2021. Mortgage rates are lower than October 2022 highs, but would have to decline substantially to generate additional refinance activity.”
...
The average contract interest rate for 30-year fixed-rate mortgages with conforming loan balances ($647,200 or less) increased to 6.58 percent from 6.42 percent, with points increasing to 0.73 from 0.65 (including the origination fee) for 80 percent loan-to-value ratio (LTV) loans.
emphasis added
 Click on graph for larger image.
The first graph shows the refinance index since 1990.
With higher mortgage rates, the refinance index declined sharply in 2022.
The refinance index is at the lowest level since the year 2000.
The second graph shows the MBA mortgage purchase index
 According to the MBA, purchase activity is down 42% year-over-year unadjusted.
The purchase index is 12% below the pandemic low and at the lowest level since 2015.
Note: Red is a four-week average (blue is weekly).
Note: Red is a four-week average (blue is weekly).
NOTE: Be careful not to read too much into holiday adjusted data.
Tuesday, January 03, 2023
Wednesday: Job Openings, ISM Mfg, Vehicle Sales, FOMC Minutes
by Calculated Risk on 1/03/2023 08:45:00 PM
 From Matthew Graham at Mortgage News Daily: Mortgage Rates Drop Modestly to Start The New Year
For now, the average lender is moving back down below the 6.5% threshold for top tier 30yr fixed rates, but just barely. That number was getting close to 6.0% in early December and was more than half a point higher as of last week. [30 year fixed 6.45%]Wednesday:
emphasis added
• At 7:00 AM ET, The Mortgage Bankers Association (MBA) will release the results for the mortgage purchase applications index.
• 10:00 AM, Job Openings and Labor Turnover Survey for October from the BLS.
• At 10:00, ISM Manufacturing Index for December. The consensus is for the ISM to be at 48.5, down from 49.0 in November.
• At 2:00 PM: FOMC Minutes, Meeting of December 13-14, 2022
• All day, Light vehicle sales for December. The Wards forecast is for 13.0 million SAAR in December, down from the BEA estimate of 14.1 million SAAR in November (Seasonally Adjusted Annual Rate).
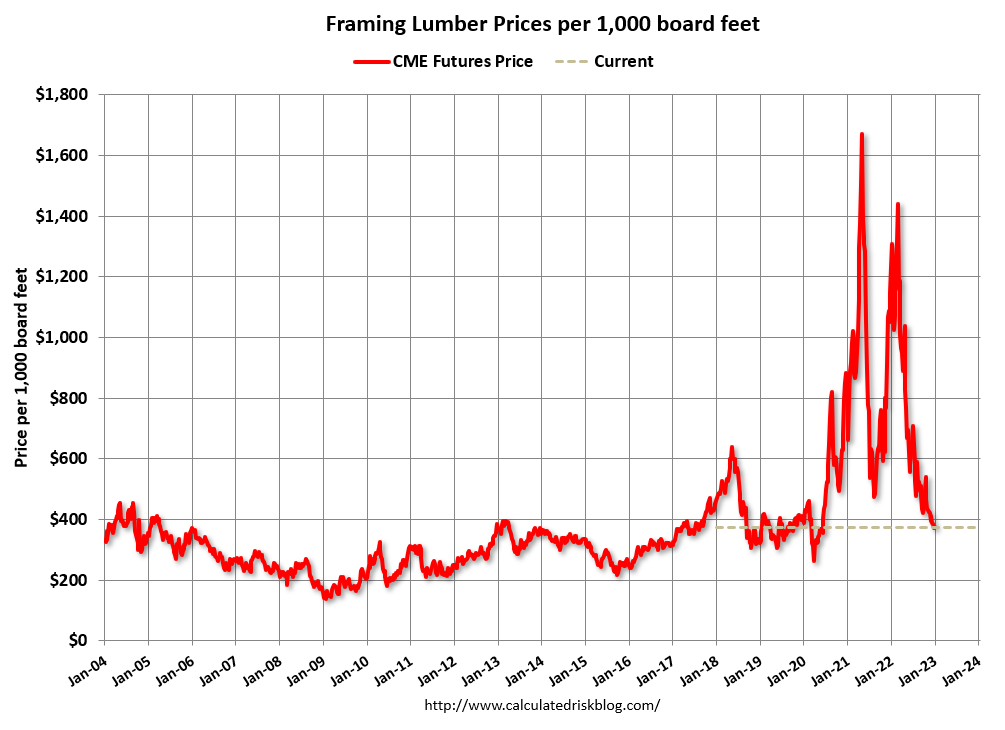
Update: Framing Lumber Prices Down 67% YoY, Slightly Below Pre-Pandemic Levels
by Calculated Risk on 1/03/2023 02:51:00 PM
Here is another monthly update on framing lumber prices.
This graph shows CME random length framing futures through January 3rd.
Lumber was at $374 per 1000 board feet this morning.
This is down from the peak of $1,733, and down 67% from $1,148 a year ago.
Prices are slightly below the pre-pandemic levels of around $400.
 Click on graph for larger image.
It is unlikely we will see a significant runup in prices this Spring due to the housing slowdown.
Prices are slightly below the pre-pandemic levels of around $400.
 Click on graph for larger image.
There is somewhat of a seasonal demand for lumber, and lumber prices usually peak in April or May.
It is unlikely we will see a significant runup in prices this Spring due to the housing slowdown.
Question #8 for 2023: How much will Residential investment change in 2023? How about housing starts and new home sales in 2023?
by Calculated Risk on 1/03/2023 11:48:00 AM
Today, in the Real Estate Newsletter: Question #8 for 2023: How much will Residential investment change in 2023? How about housing starts and new home sales in 2023?
A brief excerpt:
Earlier I posted some questions on my blog for next year: Ten Economic Questions for 2023. Some of these questions concern real estate (inventory, house prices, housing starts, new home sales), and I’ll post thoughts on those in the newsletter (others like GDP and employment will be on my blog).There is much more in the article. You can subscribe at https://calculatedrisk.substack.com/
I'm adding some thoughts, and maybe some predictions for each question.
8) Residential Investment: Residential investment (RI) was a drag on growth in 2022 as the housing market slowed sharply. Through November, starts were down 1.2% year-to-date compared to the same period in 2021. New home sales were down 15.2% year-to-date through November. Note: RI is mostly investment in new single-family structures, multifamily structures, home improvement and commissions on existing home sales. How much will RI change in 2023? How about housing starts and new home sales in 2023?
...
Here is a table showing housing starts and new home sales since 2005. Note that starts and new home sales declined sharply for several years following the housing bubble. Since I don’t expect significant distressed sales in this downturn, I don’t think the decline in starts and new home sales will be anywhere near as persistent as during the housing bust.
...
The outlook for 2023 depends on several factors: the Fed, mortgage rates, whether or not there is a recession in 2023, and inventory levels (both existing and new home inventory). My sense is this downturn will be more like each of the downturns in the 1980 period, as opposed to the six years of declining new home sales during the housing bust (there were two recessions in the 1980 period so new home sales did decline for several years). ...

Construction Spending Increased 0.2% in November
by Calculated Risk on 1/03/2023 10:37:00 AM
From the Census Bureau reported that overall construction spending increased:
Construction spending during November 2022 was estimated at a seasonally adjusted annual rate of $1,807.5 billion, 0.2 percent above the revised October estimate of $1,803.2 billion. The November figure is 8.5 percent above the November 2021 estimate of $1,665.2 billion.Private spending increased and public spending decreased:
emphasis added
Spending on private construction was at a seasonally adjusted annual rate of $1,426.4 billion, 0.3 percent above the revised October estimate of $1,421.6 billion. ...
In November, the estimated seasonally adjusted annual rate of public construction spending was $381.1 billion, 0.1 percent below the revised October estimate of $381.6 billion.
 Click on graph for larger image.
This graph shows private residential and nonresidential construction spending, and public spending, since 1993. Note: nominal dollars, not inflation adjusted.
Residential (red) spending is 8.2% below the recent peak.
Non-residential (blue) spending is at a new peak.
Public construction spending is close to the recent peak.
 The second graph shows the year-over-year change in construction spending.
On a year-over-year basis, private residential construction spending is up 5.3%. Non-residential spending is up 12.6% year-over-year. Public spending is up 10.4% year-over-year.
This was above consensus expectations of a 0.4% decrease in spending, and construction spending for the previous two months combined were revised up.
CoreLogic: House Prices up 8.6% YoY in November; Declined 0.2% MoM in November NSA
by Calculated Risk on 1/03/2023 08:33:00 AM
Notes: This CoreLogic House Price Index report is for November. The recent Case-Shiller index release was for October. The CoreLogic HPI is a three-month weighted average and is not seasonally adjusted (NSA).
From CoreLogic: Annual Home Price Growth Slows to Two-Year Low in November, CoreLogic Reports
CoreLogic® ... today released the CoreLogic Home Price Index (HPI™) and HPI Forecast™ for November 2022.
Year-over-year home price growth ended its 21-month streak of double-digit momentum in November, posting an 8.6% gain, the lowest rate of appreciation in exactly two years. Although 16 states bucked the national trend and saw annual double-digit increases, appreciation is decelerating in many popular housing markets across the country. Southeastern states still led the country for price growth in November but also saw some of the most pronounced cooling. Similarly, relatively more expensive Western areas also posted substantial combined declines in recent months since spring’s peak.
“Although home price growth has been slowing rapidly and will continue to do so in 2023, strong gains in the first half of last year suggest that total 2022 appreciation was only slightly lower than that recorded in 2021,” said Selma Hepp, executive, deputy chief economist at CoreLogic. “However, 2023 will present its own challenges, as consumers remain wary of both the housing market and the overall economic outlook.”
...
U.S. home prices (including distressed sales) increased 8.6% year over year in November 2022 compared to November 2021. On a month-over-month basis, home prices declined by 0.2% compared to October 2022.
emphasis added
Monday, January 02, 2023
Tuesday: Construction Spending
by Calculated Risk on 1/02/2023 07:08:00 PM
Weekend:
• Schedule for Week of January 1, 2023
Tuesday:
• At 8:00 AM ET, Corelogic House Price index for November.
• At 10:00 AM: Construction Spending for November. The consensus is for a 0.4% decrease in construction spending.
From CNBC: Pre-Market Data and Bloomberg futures S&P 500 are up 8, and DOW futures are up 75 (fair value).
Oil prices were mixed over the last week with WTI futures at $80.26 per barrel and Brent at $85.91 per barrel. A year ago, WTI was at $76, and Brent was at $78 - so WTI oil prices are up 4% year-over-year.
Here is a graph from Gasbuddy.com for nationwide gasoline prices. Nationally prices are at $3.18 per gallon. A year ago, prices were at $3.26 per gallon, so gasoline prices are down $0.08 per gallon year-over-year.
Question #9 for 2023: What will happen with house prices in 2023?
by Calculated Risk on 1/02/2023 01:47:00 PM
Today, in the Real Estate Newsletter: Question #9 for 2023: What will happen with house prices in 2023?
A brief excerpt:
Earlier I posted some questions on my blog for next year: Ten Economic Questions for 2023. Some of these questions concern real estate (inventory, house prices, housing starts, new home sales), and I’ll post thoughts on those in the newsletter (others like GDP and employment will be on my blog).There is much more in the article. You can subscribe at https://calculatedrisk.substack.com/
I'm adding some thoughts, and maybe some predictions for each question.
9) House Prices: It appears house prices - as measured by the national repeat sales index (Case-Shiller, FHFA, and CoreLogic) - will be up around 7% in 2022. What will happen with house prices in 2023?
The first question I’m always asked is what “Will happen with house prices?”. No one has a crystal ball, but it does appear house prices will decline in 2023.
...
The following graph - as of the NAR release last month - shows that Case-Shiller followed the median prices up and is now following the deceleration in median prices down. It is likely the median price will be down year-over-year in a few months - and Case-Shiller will follow.
Note: Median prices are distorted by the mix (repeat sales indexes like Case-Shiller and FHFA are probably better for measuring prices).

Housing January 2nd Weekly Update: Inventory Decreased 3.4% Week-over-week
by Calculated Risk on 1/02/2023 09:16:00 AM
Altos reports inventory is down 3.4% week-over-week and down 15.0% from the peak on October 28, 2022.
 Click on graph for larger image.
This inventory graph is courtesy of Altos Research.
As of December 30th, inventory was at 491 thousand (7-day average), compared to 508 thousand the prior week. Inventory has declined sharply over the holidays.

The red line is for 2022. The black line is for 2019.
Inventory was at a record low in early 2022 and was up compared to the same week in 2021 as of May 20, 2022.
Inventory was up compared to the same week in 2020 as of October 7, 2022, however, inventory will start well below 2020 levels in early 2023.
Currently inventory is up 67.3% year-over-year, and down 35.7% compared to 2019.
A key will when inventory starts increasing in 2023 (the bottom is usually in February of each year).
Mike Simonsen discusses this data regularly on Youtube.
Sunday, January 01, 2023
Reis: Office Vacancy Rate Increased in Q4 as "demand plummeted", Mall Vacancy Rate Unchanged
by Calculated Risk on 1/01/2023 09:56:00 AM
From Moody’s Analytics Senior Economist Lu Chen and economist Xiaodi Li: Apartment struck a balance, Office demand plummeted, and Retail remains flat
Corporate profits squeezed under macroeconomic uncertainties and flexible work arrangements weakened office demand and continued to transform the sector’s fundamental. Moreover, new office demand isn’t always reflected through direct leases. As office downsizing became more commonplace, sublet space inevitably followed to absorb new demand. Net absorption plummeted from over 3 million square feet (sqft) in Q3 to -7.13 million sqft in Q4.
Affected by the overall office sector sentiment, new delivery dwindled to slightly above 2 million sqft nationwide, the lowest quarterly delivery in our more than 20 years of tracking history. Vacancy climbed for the fourth straight quarter to 18.7%, 20 bps higher than the previous quarter or 60 bps higher than the same time last year. Compared to Q3, asking rent in Q4 increased by 0.3% (from $35.05 to $35.14), and effective rent edged up 0.1% (from $28.00 to $28.04).
emphasis added
Reis reported the office vacancy rate was at 18.7% in Q4 2022, up from 18.5% in Q3, and up from 18.1% in Q4 2021.
This was the highest vacancy rate for offices since 1992 (following the S&L crisis).
NOTE: This says nothing about how many people are in the offices (related to the increase in work-from-home), just whether or not the office space is leased.
 Click on graph for larger image.
This graph shows the office vacancy rate starting in 1980 (prior to 1999 the data is annual).
The office vacancy rate was elevated prior to the pandemic and moved up during the pandemic.
Reis also reported that office effective rents increased 0.1% in Q4; rents are about at the same level as before the pandemic.
And from Reis on Retail:
Bolstered by consumer spending, neighborhood and community shopping center net absorption was up 44% in Q4 as compared to last quarter. New construction delivery fell under 600,000 sqft and caused the inventory to grow just above 3 million sqft for the year, less than half of 2019’s record. Given the relative balance between supply and demand, national vacancy for neighborhood and community shopping centers stayed flat at 10.3% for the fifth straight quarter. Asking/effective rents were up slightly by 0.2%/0.2% in Q4 and remained in the $21/$18-per-sqft range, a level unchanged since 2018. Regional mall properties, on the other hand, continue to be the most at-risk retail subtype according to our commercial mortgage delinquency data, driving overall delinquency behavior among retail assets. Regional and super regional malls’ vacancy ticked up 10 bps to 11.2%, identical to the same time last year.
Reis reported that the vacancy rate for regional malls was 11.2% in Q4 2022, up from 11.1% in Q2 2021, and unchanged from 11.2% in Q4 2021. The regional mall vacancy rate peaked at 11.5% in Q2 2021.
For Neighborhood and Community malls (strip malls), the vacancy rate was 10.3% in Q4, unchanged from 10.3% in Q3, and unchanged from 10.3% in Q4 2021. For strip malls, the vacancy rate peaked during the pandemic at 10.6% in both Q1 and Q2 2021.
 This graph shows the strip mall vacancy rate starting in 1980 (prior to 2000 the data is annual). The regional mall data starts in 2000. Back in the '80s, there was overbuilding in the mall sector even as the vacancy rate was rising. This was due to the very loose commercial lending that led to the S&L crisis.
 In the mid-'00s, mall investment picked up as mall builders followed the "roof tops" of the residential boom (more loose lending). This led to the vacancy rate moving higher even before the recession started. Then there was a sharp increase in the vacancy rate during the recession and financial crisis.
In the last several years, even prior to the pandemic, the regional mall vacancy rates increased significantly from an already elevated level.
Effective rents have been mostly unchanged for regional malls over the last 4+ years, and flat for strip malls for 3+ years.
All vacancy data courtesy of Moody’s Analytics Reis


