 RSS Feed
 by Calculated Risk on 2/28/2023 08:39:00 PM
Tuesday, February 28, 2023
Wednesday: ISM Mfg, Construction Spending
 Note: Mortgage rates are from MortgageNewsDaily.com and are for top tier scenarios.
Wednesday:
• At 7:00 AM ET, The Mortgage Bankers Association (MBA) will release the results for the mortgage purchase applications index.
• At 10:00 AM, ISM Manufacturing Index for January. The consensus is for the ISM to be at 48.0, up from 47.4 in January.
• At 10:00 AM, Construction Spending for December. The consensus is for a 0.2% increase in construction spending.
Las Vegas January 2023: Visitor Traffic Down 4.0% Compared to 2019; Convention Traffic Down 24.9%
by Calculated Risk on 2/28/2023 03:00:00 PM
Note: I like using Las Vegas as a measure of recovery for both leisure (visitors) and business (conventions).
From the Las Vegas Visitor Authority: January 2023 Las Vegas Visitor Statistics
With strong weekends and rebounding attendance for conventions including the citywide tradeshows of CES, World of Concrete, and the SHOT show, Las Vegas hosted an estimated 3,275,000 visitors in January, well ahead of the lingering pandemic-suppressed volumes of January 2022 and just -4% shy of January 2019.
Overall hotel occupancy reached 79.1% for the month, +19.8 pts YoY and down -4.9 pts vs. 2019. Weekend occupancy reached 88.4%, nearly matching January 2019 levels (88.8%, -0.4 pts) while Midweek occupancy reached 75.2%, +23.2 pts vs. January 2022 but -6.9 pts vs. January 2019.
The ongoing trend of strong room rates continued in January as ADR approached $192, +32% YoY and +22.4% ahead of January 2019 while RevPAR exceeded $151, +76% YoY and +15.3% over 2019.
 Click on graph for larger image.
 The first graph shows visitor traffic for 2019 (Black), 2020 (light blue), 2021 (purple), 2022 (orange), and 2023 (red).
Visitor traffic was down 4.0% compared to the same month in 2019.
Visitor traffic was up 32.3% compared to last January.
The second graph shows convention traffic.

Convention traffic was down 24.9% compared to January 2019, but up 72.0% compared to January 2022.The second graph shows convention traffic.

Note: There was almost no convention traffic from April 2020 through May 2021.
FDIC: Problem Banks Decreased to Record Low 39 in Q4 2022
by Calculated Risk on 2/28/2023 12:46:00 PM
The FDIC released the Quarterly Banking Profile for Q4 2022:
Reports from 4,706 commercial banks and savings institutions insured by the Federal Deposit Insurance Corporation (FDIC) reflect aggregate net income of $68.4 billion in fourth quarter 2022, a decrease of $3.3 billion (4.6 percent) from the third quarter. Lower noninterest income and higher provision expenses offset an increase in net interest income. These and other financial results for fourth quarter 2022 are included in the FDIC’s latest Quarterly Banking Profile released today.
...
Asset Quality Metrics Remained Favorable Despite Modest Deterioration: Loans that were 90 days or more past due or on nonaccrual status (i.e., noncurrent loans) increased to 0.73 percent, up one basis point from the prior quarter. Noncurrent credit card and C&I loans drove the increase in the noncurrent rate. Total net charge–offs as a ratio of total loans increased 10 basis points from the prior quarter and 15 basis points from a year prior to 0.36 percent, driven by credit card, C&I, and auto loan losses. Despite the increase, the total net charge off rate remains below the pre–pandemic average of 0.48 percent. Early delinquencies (i.e., loans past due 30–89 days) increased 4 basis points from the prior quarter to 0.56 percent; one–to–four family real estate and auto loans contributed most to this growth. Total early–stage delinquencies also remain below the pre–pandemic average of 0.66 percent.
emphasis added
 Click on graph for larger image.
The FDIC reported the number of problem banks decreased to 39.
The number of FDIC-insured institutions declined from 4,746 in third quarter to 4,706 this quarter. In fourth quarter, three banks opened and 36 institutions merged with other FDIC-insured institutions. Seven institutions ceased operations. The number of banks on the FDIC’s “Problem Bank List” decreased by 3 from third quarter to 39, the lowest level in QBP history. Total assets of problem banks declined $116.3 billion to $47.5 billion. No banks failed in the fourth quarter.This graph from the FDIC shows the number of problem banks and assets at problem institutions.
Note: The number of assets for problem banks increased significantly back in 2018 when Deutsche Bank Trust Company Americas was added to the list. An even larger unknown bank was added to the list in Q4 2021, and - since problem assets dropped sharply last quarter - that bank is now off the problem list.
Comments on December Case-Shiller and FHFA House Prices
by Calculated Risk on 2/28/2023 09:49:00 AM
Today, in the Calculated Risk Real Estate Newsletter: Case-Shiller: National House Price Index "Decline Continued" to 5.8% year-over-year increase in December
Excerpt:
Both the Case-Shiller House Price Index (HPI) and the Federal Housing Finance Agency (FHFA) HPI for December were released today. Here is a graph of the month-over-month (MoM) change in the Case-Shiller National Index Seasonally Adjusted (SA).
The Case-Shiller Home Price Indices for “December” is a 3-month average of October, November and December closing prices. October closing prices include some contracts signed in August, so there is a significant lag to this data.
The MoM decrease in the seasonally adjusted Case-Shiller National Index was at -0.35%. This was the sixth consecutive MoM decrease, and a slightly larger decrease than in November.
On a seasonally adjusted basis, prices declined in all 20 Case-Shiller cities on a month-to-month basis. The largest monthly declines seasonally adjusted were in Las Vegas (-1.5%), Phoenix (-1.3%) and Portland (-1.3%). San Francisco has fallen 12.7% from the peak in May 2022 and was the first Case-Shiller city with a year-over-year decline (-4.2% year-over-year). Seattle is now down too at -1.8% YoY.

There is much more in the article. You can subscribe at https://calculatedrisk.substack.com/
Case-Shiller: National House Price Index "Decline Continued" to 5.8% year-over-year increase in December
by Calculated Risk on 2/28/2023 09:10:00 AM
S&P/Case-Shiller released the monthly Home Price Indices for December ("December" is a 3-month average of October, November and December closing prices).
This release includes prices for 20 individual cities, two composite indices (for 10 cities and 20 cities) and the monthly National index.
From S&P: S&P Corelogic Case-Shiller Index Decline Continued in December
The S&P CoreLogic Case-Shiller U.S. National Home Price NSA Index, covering all nine U.S. census divisions, reported a 5.8% annual gain in December, down from 7.6% in the previous month. The 10- City Composite annual increase came in at 4.4%, down from 6.3% in the previous month. The 20-City Composite posted a 4.6% year-over-year gain, down from 6.8% in the previous month.
Miami, Tampa, and Atlanta reported the highest year-over-year gains among the 20 cities in December. Miami led the way with a 15.9% year-over-year price increase, followed by Tampa in second with a 13.9% increase, and Atlanta in third with a 10.4% increase. All 20 cities reported lower prices in the year ending December 2022 versus the year ending November 2022.
...
Before seasonal adjustment, the U.S. National Index posted a -0.8% month-over-month decrease in December, while the 10-City and 20-City Composites posted decreases of -0.8% and -0.9%, respectively.
After seasonal adjustment, the U.S. National Index posted a month-over-month decrease of -0.3%, and the 10-City and 20-City Composites posted decreases of -0.4% and -0.5%, respectively.
In December, all 20 cities reported declines both before and after seasonal adjustments.
“The cooling in home prices that began in June 2022 continued through year end, as December marked the sixth consecutive month of declines for our National Composite Index,” says Craig J. Lazzara, Managing Director at S&P DJI. “The National Composite declined by -0.8% in December, and now stands 4.4% below its June peak. For 2022 as a whole, the National Composite rose by 5.8%, the 15th best performance in our 35-year history, although obviously well below 2021’s record-setting 18.9% gain. We could record similar observations in the 10- and 20-City Composites.
“Prices fell in all 20 cities in December, with a median decline of -1.1%. Moreover, for all 20 cities, year-over-year gains in December (median 4.4%) were lower than those of November (median 6.4%). We noted last month that home prices in San Francisco had fallen on a year-over-year basis. San Francisco’s decline worsened in December (-4.2% year-over-year); its west coast neighbors Seattle (- 1.8%) and Portland (+1.1%) once again form the bottom of the league table.
emphasis added
 Click on graph for larger image.
 The first graph shows the nominal seasonally adjusted Composite 10, Composite 20 and National indices (the Composite 20 was started in January 2000).
The Composite 10 index is down 0.4% in December (SA) and down 4.3% from the recent peak in June 2022.
The Composite 20 index is down 0.5% (SA) in December and down 4.4% from the recent peak in June 2022.
The National index is down 0.3% (SA) in December and is down 2.7% from the peak in June 2022.
 The second graph shows the year-over-year change in all three indices.
The Composite 10 SA is up 4.4% year-over-year. The Composite 20 SA is up 4.7% year-over-year.
The National index SA is up 5.8% year-over-year.
Annual price increases were lower than expected. I'll have more later.
Monday, February 27, 2023
Tuesday: Case-Shiller House Prices
by Calculated Risk on 2/27/2023 09:01:00 PM
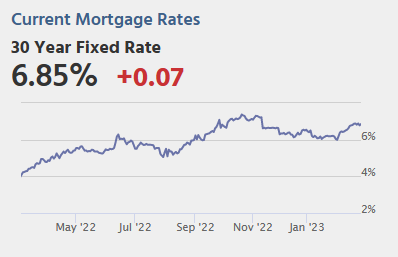
 From Matthew Graham at Mortgage News Daily: Mortgage Rates a Bit Lower to Begin The Week
Mortgage rates began the new week on a modestly positive note. The average lender is now quoting conventional 30yr fixed loans at a slightly lower rate than last Friday afternoon.Tuesday:
That said, the changes are modest, to say the least. Some borrowers won't see any detectable difference from last week's rates. Others might see an eighth of a percent lower at best.
Even in those best cases, rates remain much higher than they were to begin the month with the average lender moving up from 5.99% to 6.78% since February 2nd. [30 year fixed 6.78%]
emphasis added
• At 9:00 AM ET, FHFA House Price Index for December 2022. This was originally a GSE only repeat sales, however there is also an expanded index.
• Also, at 9:00 AM, S&P/Case-Shiller House Price Index for December. The consensus is for a 6.0% year-over-year increase in the Comp 20 index for December, down from 6.8% in November.
• At 10:00 AM, Richmond Fed Survey of Manufacturing Activity for February.
Lawler: AMH Net Seller of Existing Single-Family Homes, “Investor” Home Purchases Plunged
by Calculated Risk on 2/27/2023 04:57:00 PM
Today, in the Calculated Risk Real Estate Newsletter: Lawler: AMH Net Seller of Existing Single-Family Homes, “Investor” Home Purchases Plunged
Brief excerpt:
Some interesting data from housing economist Tom Lawler:There is much more in the post. You can subscribe at https://calculatedrisk.substack.com/.
AMH Net Seller of Existing Single-Family Homes Last Quarter
AMH (American Homes 4 Rent), which rents single-family homes and which owned almost 59,000 single-family homes at the end of last year, reported that it was a net seller of existing single-family homes last quarter. The company acquired 489 homes last quarter, but 415 of those homes were “deliveries” from its own build-to-rent program, and “most” of the remaining 74 homes were acquired under its National Builder Program. The company sold 457 homes last quarter, well above the average quarterly sales of 161 in the previous four quarters. The company also increased its inventory of single-family homes held for sale to 1,115 in December from 1,057 in September and 659 in December 2021, and company officials suggested that additional home sales were likely this quarter.

Freddie Mac Mortgage Serious Delinquency Rate unchanged in January; Fannie Mae Decreased Slightly
by Calculated Risk on 2/27/2023 04:42:00 PM
Freddie Mac reported that the Single-Family serious delinquency rate in January was 0.66%, unchanged from 0.66% December. Freddie's rate is down year-over-year from 1.06% in January 2022.
Freddie's serious delinquency rate peaked in February 2010 at 4.20% following the housing bubble and peaked at 3.17% in August 2020 during the pandemic.
Fannie Mae reported that the Single-Family Serious Delinquency decreased to 0.64% in January from 0.65% in December. The serious delinquency rate is down from 1.17% in January 2022. This is at the pre-pandemic lows.
The Fannie Mae serious delinquency rate peaked in February 2010 at 5.59% following the housing bubble and peaked at 3.32% in August 2020 during the pandemic.
These are mortgage loans that are "three monthly payments or more past due or in foreclosure".
 Click on graph for larger image
Mortgages in forbearance are being counted as delinquent in this monthly report but are not reported to the credit bureaus.
For Freddie, note that multi-family delinquencies have been increased slightly and were at 0.12% in January, up from 0.07% in January 2022.
For loans made in 2005 through 2008 (1% of portfolio), 3.40% are seriously delinquent (down from 3.49%).
For recent loans, originated in 2009 through 2021 (98% of portfolio), 0.52% are seriously delinquent (down from 0.53%). So, Fannie is still working through a handful of poor performing loans from the bubble years.
Measures of Shelter in the CPI and PCE price indexes Still Increasing
by Calculated Risk on 2/27/2023 12:15:00 PM
Today, in the Calculated Risk Real Estate Newsletter: Measures of Shelter in the CPI and PCE price indexes Still Increasing
Brief excerpt:
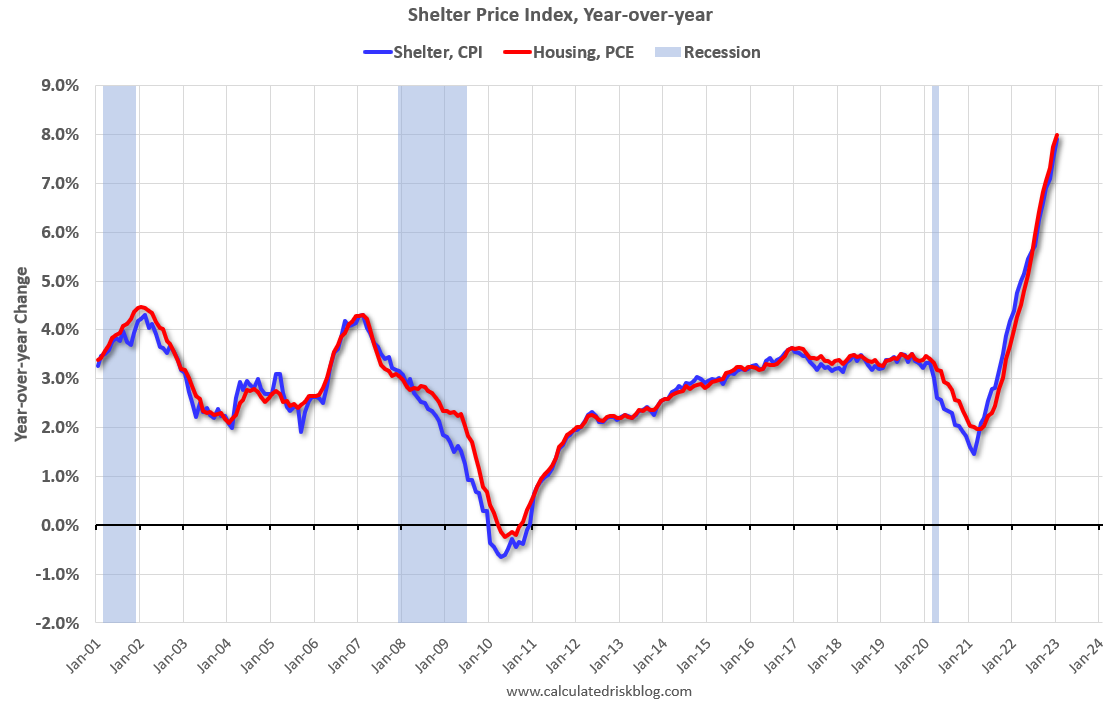
While asking rents are falling, the measures of shelter in the CPI and PCE price indexes keep rising. This is because these measures include renewals, whereas the various private measures of monthly rents are for new leases.You can subscribe at https://calculatedrisk.substack.com/.
Here is a graph of the year-over-year change in shelter from the CPI report and housing from the PCE report (both through January 2023):.
Shelter was up 7.9% year-over-year in January, and housing (PCE) was up 8.0% YoY in January.
However, there is more impacting rents than the normal lag between new leases and renewals.
NAR: Pending Home Sales Increased 8.1% in January; Down 24.1% Year-over-year
by Calculated Risk on 2/27/2023 10:05:00 AM
From the NAR: Pending Home Sales Improved for Second Straight Month, Up 8.1% in January
Pending home sales improved in January for the second consecutive month, according to the National Association of REALTORS®. All four U.S. regions posted monthly gains but saw year-over-year drops in transactions.Expectations had been for a 1.0% increase for this index. Note: Contract signings usually lead sales by about 45 to 60 days, so this would usually be for closed sales in February and March.
The Pending Home Sales Index (PHSI) — a forward-looking indicator of home sales based on contract signings — improved 8.1% to 82.5 in January. Year-over-year, pending transactions dropped by 24.1%. An index of 100 is equal to the level of contract activity in 2001.
“Buyers responded to better affordability from falling mortgage rates in December and January,” said NAR Chief Economist Lawrence Yun.
...
The Northeast PHSI rose 6.0% from last month to 68.7, a decline of 19.8% from January 2022. The Midwest index grew 7.9% to 83.3 in January, a drop of 21.1% from one year ago.
The South PHSI increased 8.3% to 99.2 in January, dipping 24.7% from the prior year. The West index elevated 10.1% in January to 66.2, diminishing 29.3% from January 2022.
emphasis added


