 RSS Feed
 by Calculated Risk on 3/01/2023 06:04:00 PM
Wednesday, March 01, 2023
Vehicles Sales at 14.89 million SAAR in February
Wards Auto released their estimate of light vehicle sales for February: U.S. Light-Vehicle Sales Record Another Gain in February, Beating Expectations (pay site).
Wards Auto estimates sales of 14.89 million SAAR in February 2023 (Seasonally Adjusted Annual Rate), down 5.4% from the January sales rate, and up 8.6% from February 2022.
 Click on graph for larger image.
This graph shows light vehicle sales since 2006 from the BEA (blue) and Wards Auto's estimate for February (red).
The impact of COVID-19 was significant, and April 2020 was the worst month. After April 2020, sales increased, and were close to sales in 2019 (the year before the pandemic). However, sales decreased late last year due to supply issues. It appears the "supply chain bottom" was in September 2021.
 The second graph shows light vehicle sales since the BEA started keeping data in 1967.
 Freddie Mac House Price Index Declines for 7th Consecutive Month in January
by Calculated Risk on 3/01/2023 10:53:00 AM
Today, in the Calculated Risk Real Estate Newsletter: Freddie Mac House Price Index Declines for 7th Consecutive Month in January
A brief excerpt:
Freddie Mac reported that its “National” Home Price Index (FMHPI) declined for the seventh consecutive month on a seasonally adjusted basis in January, putting the National FMHPI down 2.7% from its June 2022 peak, and down 5.3% Not Seasonally Adjusted (NSA) from the peak.There is much more in the article. You can subscribe at https://calculatedrisk.substack.com/
On a year-over-year basis, the National FMHPI was up 2.4% in January, down from 4.4% YoY in December. The YoY increase peaked at 19.2% in July 2021.
In January, 37 states and D.C. were below their 2022 peaks, Seasonally Adjusted. The largest seasonally adjusted declines from the recent peak were in Idaho (-9.6%), Arizona (-8.3%), D.C. (-7.3%), Washington (-7.2%), Nevada (-7.2%), California (-6.6%), Utah (-6.5%), and Colorado (-5.8%).
...
The FMHPI and the NAR median prices appear to be leading indicators for Case-Shiller, and based on the recent trend, the FMHPI will be negative year-over-year in March (reported at the end of April) - and Case-Shiller will follow soon after.

Construction Spending Decreased 0.1% in January
by Calculated Risk on 3/01/2023 10:17:00 AM
From the Census Bureau reported that overall construction spending decreased:
Construction spending during January 2023 was estimated at a seasonally adjusted annual rate of $1,825.7 billion, 0.1 percent below the revised December estimate of $1,827.5 billion. The January figure is 5.7 percent above the January 2022 estimate of $1,726.6 billion.Private spending was "virtually unchanged" and public spending decreased:
emphasis added
Spending on private construction was at a seasonally adjusted annual rate of $1,442.6 billion, virtually unchanged from the revised December estimate of $1,442.0 billion. ...
In January, the estimated seasonally adjusted annual rate of public construction spending was $383.1 billion, 0.6 percent below the revised December estimate of $385.5 billion.
 Click on graph for larger image.
This graph shows private residential and nonresidential construction spending, and public spending, since 1993. Note: nominal dollars, not inflation adjusted.
Residential (red) spending is 9.4% below the recent peak.
Non-residential (blue) spending is at a new peak.
Public construction spending is close to the recent peak.
 The second graph shows the year-over-year change in construction spending.
On a year-over-year basis, private residential construction spending is down 3.9%. Non-residential spending is up 19.1% year-over-year. Public spending is up 11.1% year-over-year.
This was below consensus expectations of a 0.2% increase in spending, however construction spending for the previous two months combined were revised up.
ISM® Manufacturing index Increased to 47.7% in February
by Calculated Risk on 3/01/2023 10:03:00 AM
(Posted with permission). The ISM manufacturing index indicated contraction. The PMI® was at 47.7% in February, up from 47.4% in January. The employment index was at 49.1%, down from 50.6% last month, and the new orders index was at 47.0%, up from 42.5%.
From ISM: Manufacturing PMI® at 47.7%
February 2023 Manufacturing ISM® Report On Business®
Economic activity in the manufacturing sector contracted in February for the fourth consecutive month following a 28-month period of growth, say the nation's supply executives in the latest Manufacturing ISM® Report On Business®.This suggests manufacturing contracted in February. This was below the consensus forecast.
The report was issued today by Timothy R. Fiore, CPSM, C.P.M., Chair of the Institute for Supply Management® (ISM®) Manufacturing Business Survey Committee:
“The February Manufacturing PMI® registered 47.7 percent, 0.3 percentage point higher than the 47.4 percent recorded in January. Regarding the overall economy, this figure indicates a third month of contraction after a 30-month period of expansion. In the last two months, the Manufacturing PMI® has been at its lowest levels since May 2020, when it registered 43.5 percent. The New Orders Index remained in contraction territory at 47 percent, 4.5 percentage points higher than the figure of 42.5 percent recorded in January. The Production Index reading of 47.3 percent is a 0.7-percentage point decrease compared to January’s figure of 48 percent. The Prices Index registered 51.3 percent, up 6.8 percentage points compared to the January figure of 44.5 percent. The Backlog of Orders Index registered 45.1 percent, 1.7 percentage points higher than the January reading of 43.4 percent. The Employment Index dropped into contraction territory, registering 49.1 percent, down 1.5 percentage points from January’s 50.6 percent. The Supplier Deliveries Index figure of 45.2 percent is 0.4 percentage point lower than the 45.6 percent recorded in January; readings from the last three months are the index’s lowest since March 2009 (43.2 percent). The Inventories Index registered 50.1 percent, 0.1 percentage point lower than the January reading of 50.2 percent. The New Export Orders Index reading of 49.9 percent is 0.5 percentage point higher than January’s figure of 49.4 percent. The Imports Index continued in contraction territory at 49.9 percent, 2.1 percentage points above the January reading of 47.8 percent.”
emphasis added
MBA: Mortgage Purchase Applications Decreased, Lowest Level Since 1995
by Calculated Risk on 3/01/2023 07:00:00 AM
From the MBA: Mortgage Applications Decrease in Latest MBA Weekly Survey
Mortgage applications decreased 5.7 percent from one week earlier, according to data from the Mortgage Bankers Association’s (MBA) Weekly Mortgage Applications Survey for the week ending February 24, 2023.
The Market Composite Index, a measure of mortgage loan application volume, decreased 5.7 percent on a seasonally adjusted basis from one week earlier. On an unadjusted basis, the Index decreased 4 percent compared with the previous week. The Refinance Index decreased 6 percent from the previous week and was 74 percent lower than the same week one year ago. The seasonally adjusted Purchase Index decreased 6 percent from one week earlier. The unadjusted Purchase Index decreased 3 percent compared with the previous week and was 44 percent lower than the same week one year ago.
“The 30-year fixed rate increased to 6.71 percent last week, the highest rate since November 2022, which drove a 6 percent drop in applications. After a brief revival in application activity in January when mortgage rates dropped down to 6.2 percent, there has now been three straight weeks of declines in applications as mortgage rates have jumped 50 basis points over the past month,” said Joel Kan, MBA’s Vice President and Deputy Chief Economist. “Data on inflation, employment, and economic activity have signaled that inflation may not be cooling as quickly as anticipated, which continues to put upward pressure on rates.”
Added Kan, “Both purchase and refinance applications declined last week, with purchase index at a 28- year low for a second consecutive week. Purchase applications were 44 percent lower than a year ago, as homebuyers again retreat to the sidelines as higher rates crimp affordability. Refinance applications account for less than a third of all applications and remained more than 70 percent behind last year’s pace, as a majority of homeowners are already locked into lower rates.”
emphasis added
 Click on graph for larger image.
The first graph shows the refinance index since 1990.
With higher mortgage rates, the refinance index declined sharply in 2022.
Other than the lows in Q4 of 2022 and early this year, the refinance index was at the lowest level since the year 2000.
The second graph shows the MBA mortgage purchase index.
 According to the MBA, purchase activity is down 44% year-over-year unadjusted.
 The purchase index is 24% below the pandemic low and at the lowest level since early 1995!
Note: Red is a four-week average (blue is weekly).
Tuesday, February 28, 2023
Wednesday: ISM Mfg, Construction Spending
by Calculated Risk on 2/28/2023 08:39:00 PM
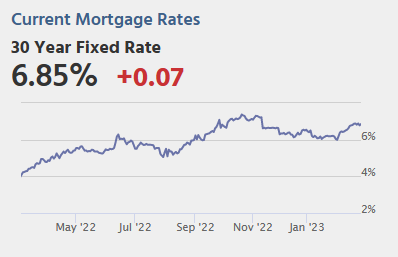 Note: Mortgage rates are from MortgageNewsDaily.com and are for top tier scenarios.
Wednesday:
• At 7:00 AM ET, The Mortgage Bankers Association (MBA) will release the results for the mortgage purchase applications index.
• At 10:00 AM, ISM Manufacturing Index for January. The consensus is for the ISM to be at 48.0, up from 47.4 in January.
• At 10:00 AM, Construction Spending for December. The consensus is for a 0.2% increase in construction spending.
Las Vegas January 2023: Visitor Traffic Down 4.0% Compared to 2019; Convention Traffic Down 24.9%
by Calculated Risk on 2/28/2023 03:00:00 PM
Note: I like using Las Vegas as a measure of recovery for both leisure (visitors) and business (conventions).
From the Las Vegas Visitor Authority: January 2023 Las Vegas Visitor Statistics
With strong weekends and rebounding attendance for conventions including the citywide tradeshows of CES, World of Concrete, and the SHOT show, Las Vegas hosted an estimated 3,275,000 visitors in January, well ahead of the lingering pandemic-suppressed volumes of January 2022 and just -4% shy of January 2019.
Overall hotel occupancy reached 79.1% for the month, +19.8 pts YoY and down -4.9 pts vs. 2019. Weekend occupancy reached 88.4%, nearly matching January 2019 levels (88.8%, -0.4 pts) while Midweek occupancy reached 75.2%, +23.2 pts vs. January 2022 but -6.9 pts vs. January 2019.
The ongoing trend of strong room rates continued in January as ADR approached $192, +32% YoY and +22.4% ahead of January 2019 while RevPAR exceeded $151, +76% YoY and +15.3% over 2019.
 Click on graph for larger image.
 The first graph shows visitor traffic for 2019 (Black), 2020 (light blue), 2021 (purple), 2022 (orange), and 2023 (red).
Visitor traffic was down 4.0% compared to the same month in 2019.
Visitor traffic was up 32.3% compared to last January.
The second graph shows convention traffic.

Convention traffic was down 24.9% compared to January 2019, but up 72.0% compared to January 2022.The second graph shows convention traffic.

Note: There was almost no convention traffic from April 2020 through May 2021.
FDIC: Problem Banks Decreased to Record Low 39 in Q4 2022
by Calculated Risk on 2/28/2023 12:46:00 PM
The FDIC released the Quarterly Banking Profile for Q4 2022:
Reports from 4,706 commercial banks and savings institutions insured by the Federal Deposit Insurance Corporation (FDIC) reflect aggregate net income of $68.4 billion in fourth quarter 2022, a decrease of $3.3 billion (4.6 percent) from the third quarter. Lower noninterest income and higher provision expenses offset an increase in net interest income. These and other financial results for fourth quarter 2022 are included in the FDIC’s latest Quarterly Banking Profile released today.
...
Asset Quality Metrics Remained Favorable Despite Modest Deterioration: Loans that were 90 days or more past due or on nonaccrual status (i.e., noncurrent loans) increased to 0.73 percent, up one basis point from the prior quarter. Noncurrent credit card and C&I loans drove the increase in the noncurrent rate. Total net charge–offs as a ratio of total loans increased 10 basis points from the prior quarter and 15 basis points from a year prior to 0.36 percent, driven by credit card, C&I, and auto loan losses. Despite the increase, the total net charge off rate remains below the pre–pandemic average of 0.48 percent. Early delinquencies (i.e., loans past due 30–89 days) increased 4 basis points from the prior quarter to 0.56 percent; one–to–four family real estate and auto loans contributed most to this growth. Total early–stage delinquencies also remain below the pre–pandemic average of 0.66 percent.
emphasis added
 Click on graph for larger image.
The FDIC reported the number of problem banks decreased to 39.
The number of FDIC-insured institutions declined from 4,746 in third quarter to 4,706 this quarter. In fourth quarter, three banks opened and 36 institutions merged with other FDIC-insured institutions. Seven institutions ceased operations. The number of banks on the FDIC’s “Problem Bank List” decreased by 3 from third quarter to 39, the lowest level in QBP history. Total assets of problem banks declined $116.3 billion to $47.5 billion. No banks failed in the fourth quarter.This graph from the FDIC shows the number of problem banks and assets at problem institutions.
Note: The number of assets for problem banks increased significantly back in 2018 when Deutsche Bank Trust Company Americas was added to the list. An even larger unknown bank was added to the list in Q4 2021, and - since problem assets dropped sharply last quarter - that bank is now off the problem list.
Comments on December Case-Shiller and FHFA House Prices
by Calculated Risk on 2/28/2023 09:49:00 AM
Today, in the Calculated Risk Real Estate Newsletter: Case-Shiller: National House Price Index "Decline Continued" to 5.8% year-over-year increase in December
Excerpt:
Both the Case-Shiller House Price Index (HPI) and the Federal Housing Finance Agency (FHFA) HPI for December were released today. Here is a graph of the month-over-month (MoM) change in the Case-Shiller National Index Seasonally Adjusted (SA).
The Case-Shiller Home Price Indices for “December” is a 3-month average of October, November and December closing prices. October closing prices include some contracts signed in August, so there is a significant lag to this data.
The MoM decrease in the seasonally adjusted Case-Shiller National Index was at -0.35%. This was the sixth consecutive MoM decrease, and a slightly larger decrease than in November.
On a seasonally adjusted basis, prices declined in all 20 Case-Shiller cities on a month-to-month basis. The largest monthly declines seasonally adjusted were in Las Vegas (-1.5%), Phoenix (-1.3%) and Portland (-1.3%). San Francisco has fallen 12.7% from the peak in May 2022 and was the first Case-Shiller city with a year-over-year decline (-4.2% year-over-year). Seattle is now down too at -1.8% YoY.

There is much more in the article. You can subscribe at https://calculatedrisk.substack.com/
Case-Shiller: National House Price Index "Decline Continued" to 5.8% year-over-year increase in December
by Calculated Risk on 2/28/2023 09:10:00 AM
S&P/Case-Shiller released the monthly Home Price Indices for December ("December" is a 3-month average of October, November and December closing prices).
This release includes prices for 20 individual cities, two composite indices (for 10 cities and 20 cities) and the monthly National index.
From S&P: S&P Corelogic Case-Shiller Index Decline Continued in December
The S&P CoreLogic Case-Shiller U.S. National Home Price NSA Index, covering all nine U.S. census divisions, reported a 5.8% annual gain in December, down from 7.6% in the previous month. The 10- City Composite annual increase came in at 4.4%, down from 6.3% in the previous month. The 20-City Composite posted a 4.6% year-over-year gain, down from 6.8% in the previous month.
Miami, Tampa, and Atlanta reported the highest year-over-year gains among the 20 cities in December. Miami led the way with a 15.9% year-over-year price increase, followed by Tampa in second with a 13.9% increase, and Atlanta in third with a 10.4% increase. All 20 cities reported lower prices in the year ending December 2022 versus the year ending November 2022.
...
Before seasonal adjustment, the U.S. National Index posted a -0.8% month-over-month decrease in December, while the 10-City and 20-City Composites posted decreases of -0.8% and -0.9%, respectively.
After seasonal adjustment, the U.S. National Index posted a month-over-month decrease of -0.3%, and the 10-City and 20-City Composites posted decreases of -0.4% and -0.5%, respectively.
In December, all 20 cities reported declines both before and after seasonal adjustments.
“The cooling in home prices that began in June 2022 continued through year end, as December marked the sixth consecutive month of declines for our National Composite Index,” says Craig J. Lazzara, Managing Director at S&P DJI. “The National Composite declined by -0.8% in December, and now stands 4.4% below its June peak. For 2022 as a whole, the National Composite rose by 5.8%, the 15th best performance in our 35-year history, although obviously well below 2021’s record-setting 18.9% gain. We could record similar observations in the 10- and 20-City Composites.
“Prices fell in all 20 cities in December, with a median decline of -1.1%. Moreover, for all 20 cities, year-over-year gains in December (median 4.4%) were lower than those of November (median 6.4%). We noted last month that home prices in San Francisco had fallen on a year-over-year basis. San Francisco’s decline worsened in December (-4.2% year-over-year); its west coast neighbors Seattle (- 1.8%) and Portland (+1.1%) once again form the bottom of the league table.
emphasis added
 Click on graph for larger image.
 The first graph shows the nominal seasonally adjusted Composite 10, Composite 20 and National indices (the Composite 20 was started in January 2000).
The Composite 10 index is down 0.4% in December (SA) and down 4.3% from the recent peak in June 2022.
The Composite 20 index is down 0.5% (SA) in December and down 4.4% from the recent peak in June 2022.
The National index is down 0.3% (SA) in December and is down 2.7% from the peak in June 2022.
 The second graph shows the year-over-year change in all three indices.
The Composite 10 SA is up 4.4% year-over-year. The Composite 20 SA is up 4.7% year-over-year.
The National index SA is up 5.8% year-over-year.
Annual price increases were lower than expected. I'll have more later.


