 RSS Feed
 by Calculated Risk on 3/03/2023 11:57:00 AM
Friday, March 03, 2023
Inflation Adjusted House Prices 3.9% Below Peak
Today, in the Calculated Risk Real Estate Newsletter: Inflation Adjusted House Prices 3.9% Below Peak; Price-to-rent index is 7.1% below recent peak
Excerpt:
It has been 17 years since the bubble peak. In the December Case-Shiller house price index released on Tuesday, the seasonally adjusted National Index (SA), was reported as being 61% above the bubble peak in 2006. However, in real terms, the National index (SA) is about 11% above the bubble peak (and historically there has been an upward slope to real house prices). The composite 20, in real terms, is about 1% above the bubble peak.
These inflation adjusted indexes have been declining for seven months in real terms. ...
In October 2004, Fed economist John Krainer and researcher Chishen Wei wrote a Fed letter on price to rent ratios: House Prices and Fundamental Value. Kainer and Wei presented a price-to-rent ratio using the OFHEO house price index and the Owners' Equivalent Rent (OER) from the BLS.
Note that OER is lagging behind other measures of rent.
Here is a similar graph using the Case-Shiller National and Composite 20 House Price Indexes. This graph shows the price to rent ratio (January 2000 = 1.0). The price-to-rent ratio had been moving more sideways but picked up significantly following the onset of the pandemic.
On a price-to-rent basis, the Case-Shiller National and Composite 20 indexes declined again in December for the seventh consecutive month. The price-to-rent index for the National index is off 7.1% from the recent peak, and the Composite 20 based index is off 8.7%.

There is much more in the article. You can subscribe at https://calculatedrisk.substack.com/
ISM® Services Index at 55.1% in February
by Calculated Risk on 3/03/2023 10:03:00 AM
(Posted with permission). The ISM® Services index was at 55.1%, down from 55.2% last month. The employment index increased to 54.0%, from 50.0%. Note: Above 50 indicates expansion, below 50 in contraction.
From the Institute for Supply Management: Services PMI® at 55.1% February 2023 Services ISM® Report On Business®
Economic activity in the services sector expanded in February for the second consecutive month as the Services PMI® registered 55.1 percent, say the nation's purchasing and supply executives in the latest Services ISM® Report On Business®. The sector has grown in 32 of the last 33 months, with the lone contraction in December.The PMI was higher than expected and the employment index was above 50.
The report was issued today by Anthony Nieves, CPSM, C.P.M., A.P.P., CFPM, Chair of the Institute for Supply Management® (ISM®) Services Business Survey Committee: “In February, the Services PMI® registered 55.1 percent, 0.1 percentage point lower than January’s reading of 55.2 percent. The composite index indicated growth in February for the second consecutive month after a reading of 49.2 percent in December, the first contraction since May 2020 (45.4 percent). The Business Activity Index registered 56.3 percent, a 4.1-percentage point decrease compared to the reading of 60.4 percent in January. The New Orders Index expanded in February for the second consecutive month after contracting in December for the first time since May 2020; the figure of 62.6 percent is 2.2 percentage points higher than the January reading of 60.4 percent.
emphasis added
Heavy Truck Sales Unchanged Year-over-year
by Calculated Risk on 3/03/2023 08:57:00 AM
The BEA released their estimate of vehicle sales for February yesterday.
This graph shows heavy truck sales since 1967 using data from the BEA. The dashed line is the February 2023 seasonally adjusted annual sales rate (SAAR).
Heavy truck sales really collapsed during the great recession, falling to a low of 180 thousand SAAR in May 2009. Then heavy truck sales increased to a new all-time high of 570 thousand SAAR in April 2019.
 Click on graph for larger image.
Note: "Heavy trucks - trucks more than 14,000 pounds gross vehicle weight."
Heavy truck sales declined sharply at the beginning of the pandemic, falling to a low of 308 thousand SAAR in May 2020.
Heavy truck sales were at 450 thousand SAAR in February, down from 503 thousand in January, and essentially unchanged from 451 thousand SAAR in February 2022.
Usually, heavy truck sales decline sharply prior to a recession. Sales were solid in February.
Thursday, March 02, 2023
"Mortgage Rates Now Back Above 7%"
by Calculated Risk on 3/02/2023 08:22:00 PM
 From Matthew Graham at Mortgage News Daily: Mortgage Rates Now Back Above 7%
Mortgage rates have been hit hard on two fronts over the past month. The first front is the obvious one: the bond market has moved in a way that forces rates to go higher. To be fair, it's almost always the bond market that forces rates to go wherever they're going.
...
There's a different problem in the "everything else" category right now. The regulator overseeing Fannie and Freddie recently changed some of the upfront fees required for all conforming mortgages (conforming = guaranteed by Fannie and Freddie). Depending on a borrower's credit score and the amount of a home's value they wish to borrow, their rate could instantly rise by 0.125% simply because a lender implemented the new fee requirements.
Without the impact of those fees, rates could still be in the high 6% range, or close to it. As it stands, the average lender is now back up into the low 7's for a well-qualified 30yr fixed scenario. These aren't the highest levels we've seen during this cycle, but they are the highest in more than 4 months (and not too far away from the long-term highs just under 7.4%). [30 year fixed 7.10%]
emphasis added
Realtor.com Reports Weekly Active Inventory Up 67% YoY; New Listings Down 16% YoY
by Calculated Risk on 3/02/2023 03:09:00 PM
Realtor.com has monthly and weekly data on the existing home market. Here is their weekly report released today from Chief economist Danielle Hale: Weekly Housing Trends View — Data Week Ending Feb 25, 2023
• Active inventory growth continued to climb with for-sale homes up 67% above one year ago. Inventories of for-sale homes rose again, but climbed on par with last week’s pace, which was a slightly slower yearly pace than we saw late January and early February. With new listings continuing to slip, the growing number of homes for sale reflects still-low buyer interest amid high costs rather than an influx of sellers.
...
• New listings–a measure of sellers putting homes up for sale–were again down, this week by 16% from one year ago. For 34 weeks now, fewer homeowners put their homes on the market for sale than at this time last year. The gap has hovered in double-digit territory this year, but is slightly smaller than we saw in the last quarter of 2022.
 Here is a graph of the year-over-year change in inventory according to realtor.com.
 Inventory is still up sharply year-over-year; however, the increase has slowed recently.
Hotels: Occupancy Rate Down 1.5% Compared to Same Week in 2019
by Calculated Risk on 3/02/2023 11:57:00 AM
From CoStar: STR: Weekly US Hotel Occupancy Eclipses 64%
U.S. hotel performance increased from the previous week, according to STR‘s latest data through Feb. 25.The following graph shows the seasonal pattern for the hotel occupancy rate using the four-week average.
Feb. 19-25, 2023 (percentage change from comparable week in 2019*):
• Occupancy: 64.2% (-1.5%)
• Average daily rate (ADR): US$156.51 (+22.2%)
• Revenue per available room (RevPAR): US$100.43 (+20.3%)
*Due to the pandemic impact, STR is measuring recovery against comparable time periods from 2019. Year-over-year comparisons will once again become standard after Q1.
emphasis added
NOTE: Last year, the occupancy rate was close to normal after the first quarter (depressed due to a surge in COVID), so STR will be comparing to 2022 after Q1.
 Click on graph for larger image.
The red line is for 2023, black is 2020, blue is the median, and dashed light blue is for 2022. Dashed purple is 2019 (STR is comparing to a strong year for hotels).
 Click on graph for larger image.
The red line is for 2023, black is 2020, blue is the median, and dashed light blue is for 2022. Dashed purple is 2019 (STR is comparing to a strong year for hotels).
The 4-week average of the occupancy rate is close to the median rate for the previous 20 years (Blue).
Note: Y-axis doesn't start at zero to better show the seasonal change.
The 4-week average of the occupancy rate will increase seasonally for several more weeks.
Year-over-year Rent Growth Continues to Decelerate
by Calculated Risk on 3/02/2023 09:23:00 AM
Today, in the Calculated Risk Real Estate Newsletter: Year-over-year Rent Growth Continues to Decelerate
A brief excerpt:
The rental market has changed significantly from 2021 and the first half of 2022.There is much more in the article. You can subscribe at https://calculatedrisk.substack.com/
...
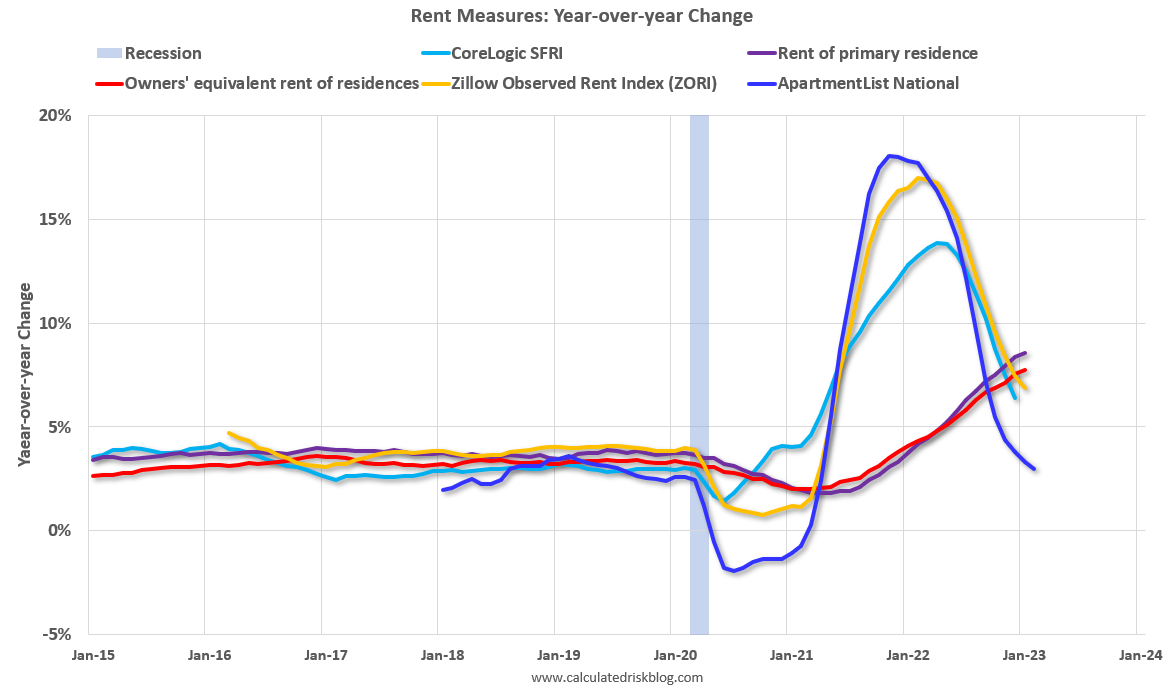
Here is a graph of the year-over-year (YoY) change for these measures since January 2015. Most of these measures are through January 2023, except CoreLogic is through December and Apartment List is through February 2023.
Note that new lease measures (Zillow, Apartment List) dipped early in the pandemic, whereas the BLS measures were steady. Then new leases took off, and the BLS measures are picking up.
The CoreLogic measure is up 6.4% YoY in December, down from 7.5% in November, and down from a peak of 13.9% in April 2022.
The Zillow measure is up 6.9% YoY in January, down from 7.5% YoY in December, and down from a peak of 17.0% YoY in February 2022.
The ApartmentList measure is up 3.0% YoY as of February, down from 3.3% in January, and down from a peak of 18.0% YoY November 2021.
...
Rents are still increasing YoY, and we should expect this to continue to spill over into measures of inflation. The Owners’ Equivalent Rent (OER) was up 7.8% YoY in January, from 7.5% YoY in November - and might increase further in the coming months even as rents slow.
Weekly Initial Unemployment Claims decrease to 190,000
by Calculated Risk on 3/02/2023 08:35:00 AM
The DOL reported:
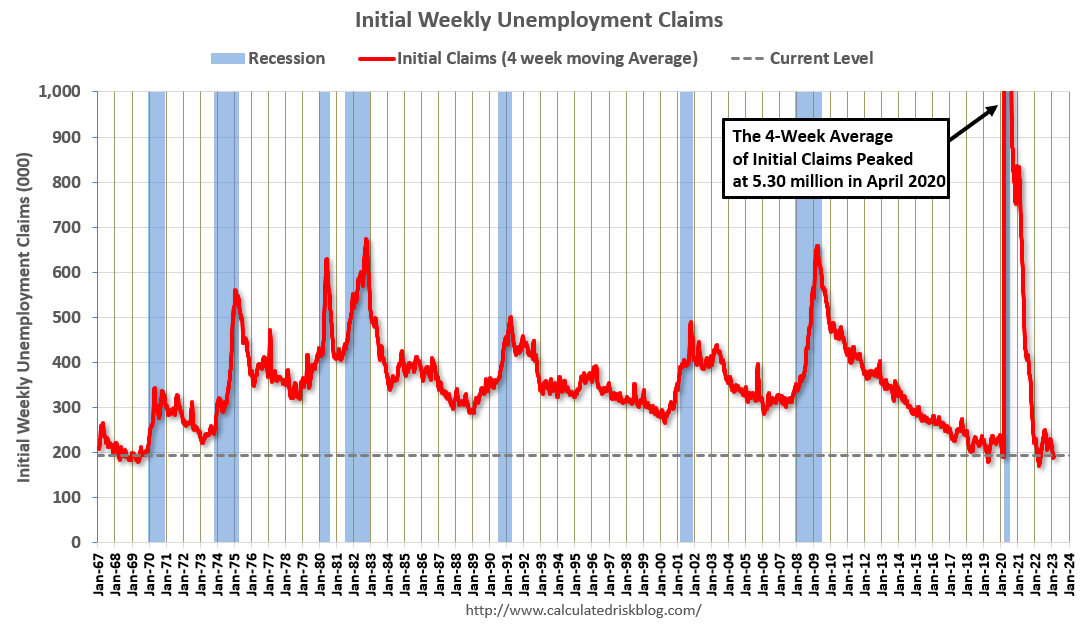
In the week ending February 25, the advance figure for seasonally adjusted initial claims was 190,000, a decrease of 2,000 from the previous week's unrevised level of 192,000. The 4-week moving average was 193,000, an increase of 1,750 from the previous week's unrevised average of 191,250.The following graph shows the 4-week moving average of weekly claims since 1971.
emphasis added
 Click on graph for larger image.
The dashed line on the graph is the current 4-week average. The four-week average of weekly unemployment claims increased to 193,000.
The previous week was unrevised.
Weekly claims were below the consensus forecast.
Wednesday, March 01, 2023
Thursday: Unemployment Claims
by Calculated Risk on 3/01/2023 08:16:00 PM
 Note: Mortgage rates are from MortgageNewsDaily.com and are for top tier scenarios.
Thursday:
• At 8:30 AM ET, The initial weekly unemployment claims report will be released. The consensus is for 197 thousand initial claims, up from 192 thousand last week.
Vehicles Sales at 14.89 million SAAR in February
by Calculated Risk on 3/01/2023 06:04:00 PM
Wards Auto released their estimate of light vehicle sales for February: U.S. Light-Vehicle Sales Record Another Gain in February, Beating Expectations (pay site).
Wards Auto estimates sales of 14.89 million SAAR in February 2023 (Seasonally Adjusted Annual Rate), down 5.4% from the January sales rate, and up 8.6% from February 2022.
 Click on graph for larger image.
This graph shows light vehicle sales since 2006 from the BEA (blue) and Wards Auto's estimate for February (red).
The impact of COVID-19 was significant, and April 2020 was the worst month. After April 2020, sales increased, and were close to sales in 2019 (the year before the pandemic). However, sales decreased late last year due to supply issues. It appears the "supply chain bottom" was in September 2021.
 The second graph shows light vehicle sales since the BEA started keeping data in 1967.

