 RSS Feed
 by Calculated Risk on 3/27/2023 08:26:00 PM
Monday, March 27, 2023
Tuesday: Case-Shiller House Prices
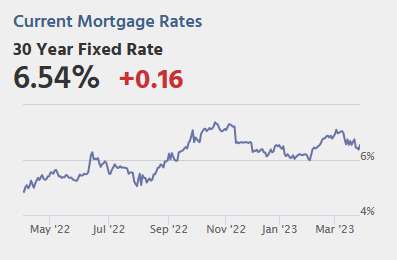 From Matthew Graham at Mortgage News Daily: Mortgage Rates Moving Back Up From 6 Week Lows
Mortgage rates hit their lowest levels in just over 6 weeks on Friday as investors braced for bad news in the banking sector. Such fears tend pull money out of the stock market and into bonds. Excess bond demand means lower rates, all other things being equal.Tuesday:
After a weekend without any new bank drama, investors were able to move back in the other direction. News regarding the sale of most of Silicon Valley Bank's deposits and loans only added to the momentum.
...
The average lender was down below 6.5% for a flawless 30yr fixed scenario on Friday, but is now back above. [30 year fixed 6.54%]
emphasis added
• At 9:00 AM ET, S&P/Case-Shiller House Price Index for January. The consensus is for a 2.5% year-over-year increase in the Comp 20 index for January, down from 4.6% YoY in December.
• Also at 9:00 AM, FHFA House Price Index for January 2021. This was originally a GSE only repeat sales, however there is also an expanded index.
• At 10:00 AM, Richmond Fed Survey of Manufacturing Activity for March. This is the last of the regional surveys for March.
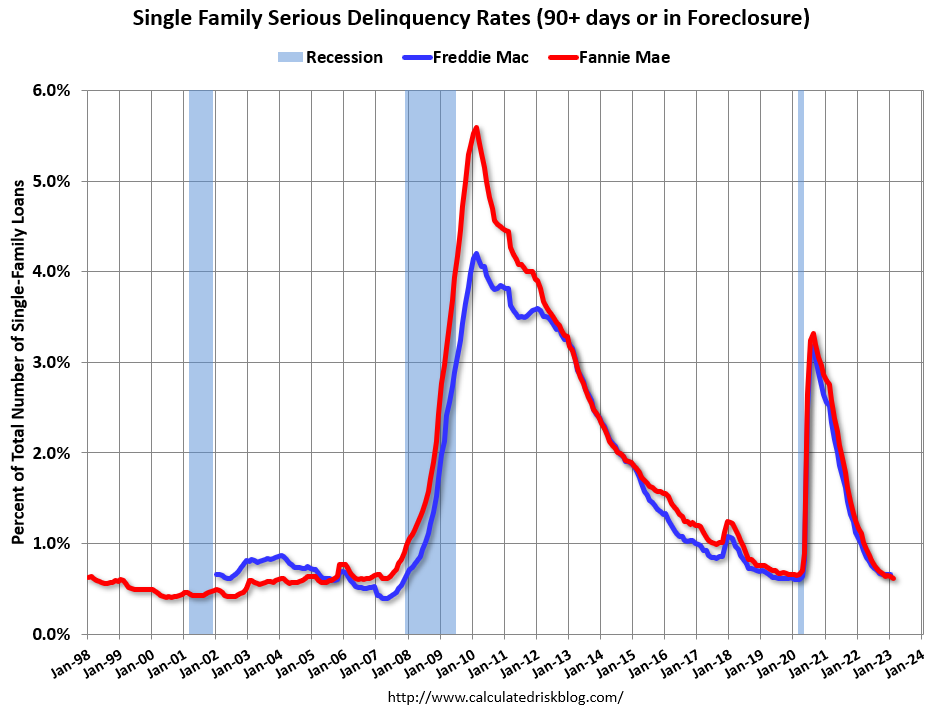
Fannie Mae: Mortgage Serious Delinquency Rate Decreased in February
by Calculated Risk on 3/27/2023 04:23:00 PM
Fannie Mae reported that the Single-Family Serious Delinquency decreased to 0.62% in February from 0.64% in January. The serious delinquency rate is down from 1.11% in February 2022. This is below the pre-pandemic levels.
These are mortgage loans that are "three monthly payments or more past due or in foreclosure".
The Fannie Mae serious delinquency rate peaked in February 2010 at 5.59% following the housing bubble and peaked at 3.32% in August 2020 during the pandemic.
 Click on graph for larger image
By vintage, for loans made in 2004 or earlier (1% of portfolio), 2.04% are seriously delinquent (down from 2.11% in January).
For loans made in 2005 through 2008 (1% of portfolio), 3.31% are seriously delinquent (down from 3.40%),
For recent loans, originated in 2009 through 2021 (98% of portfolio), 0.51% are seriously delinquent (down from 0.52%). So, Fannie is still working through a few poor performing loans from the bubble years.
Mortgages in forbearance were counted as delinquent in this monthly report, but they were not reported to the credit bureaus.
Mortgages in forbearance were counted as delinquent in this monthly report, but they were not reported to the credit bureaus.
DOT: Vehicle Miles Driven Increased 5.6% year-over-year in January
by Calculated Risk on 3/27/2023 02:42:00 PM
This is something I check occasionally.
The Department of Transportation (DOT) reported:
Travel on all roads and streets changed by +5.6% (+13.2 billion vehicle miles) for January 2023 as compared with January 2022. Travel for the month is estimated to be 247.3 billion vehicle miles.
The seasonally adjusted vehicle miles traveled for January 2023 is 272.5 billion miles, a 4.5% (11.6 billion vehicle miles) change over January 2022. It also represents a 3.1% change (8.1 billion vehicle miles) compared with December 2022.
emphasis added
 Click on graph for larger image.
This graph shows the monthly total vehicle miles driven, seasonally adjusted.
Miles driven declined sharply in March 2020, and really collapsed in April 2020. After recovering, miles driven were softer early in 2022 due to higher gasoline prices but have increased since gasoline prices are now down sharply year-over-year.
Housing March 27th Weekly Update: Inventory Decreased 0.3% Week-over-week
by Calculated Risk on 3/27/2023 08:34:00 AM
Altos reports that active single-family inventory was down 0.3% week-over-week. Inventory might have bottomed seasonally two weeks ago.
 Click on graph for larger image.
This inventory graph is courtesy of Altos Research.
As of March 24th, inventory was at 413 thousand (7-day average), compared to 414 thousand the prior week.
Year-to-date, inventory is down 15.8%, and up 0.2% from the possible seasonal bottom two weeks ago.

The red line is for 2023. The black line is for 2019. Note that inventory is up from the previous two years (the record low was in 2022), but still well below normal levels.
Inventory was up 64.3% compared to the same week in 2022 (last week it was up 68.6%), and down 50.2% compared to the same week in 2019 (last week down 49.7%).
A key will be when inventory starts increasing in 2023 - and this might be the start of the usual summer increase in inventory.
Mike Simonsen discusses this data regularly on Youtube.
Sunday, March 26, 2023
Sunday Night Futures
by Calculated Risk on 3/26/2023 08:42:00 PM
Weekend:
• Schedule for Week of March 26, 2023
Monday:
• At 10:30 AM ET, Dallas Fed Survey of Manufacturing Activity for March.
From CNBC: Pre-Market Data and Bloomberg futures S&P 500 futures are up 13 and DOW futures are up 100 (fair value).
Oil prices were up over the last week with WTI futures at $69.26 per barrel and Brent at $74.99 per barrel. A year ago, WTI was at $116, and Brent was at $123 - so WTI oil prices are DOWN 40% year-over-year.
Here is a graph from Gasbuddy.com for nationwide gasoline prices. Nationally prices are at $3.42 per gallon. A year ago, prices were at $4.23 per gallon, so gasoline prices are down $0.81 per gallon year-over-year.
Off-Topic: This is Personal
by Calculated Risk on 3/26/2023 05:12:00 PM
A friend’s brother was brutally murdered and his killer sentenced to death. Here is a piece from my friend Eric in Newsweek and a few comments about the family’s ongoing fight for justice: 'My Brother's Horrific Murder Shocked Police. His Killer Is Up for Parole'
Like Charles Manson and Sirhan Sirhan, the murderer’s sentence was changed to life imprisonment WITH the possibility of parole after the death penalty was abolished in California. This was the 2nd harshest penalty in the ‘70s. Now the harshest penalty is life in prison without parole.
This has made the victim’s family relive this horrific event over and over. On April 25, 2023, the killer will be up for parole again. This will be the 18th time my friend’s family will provide a victim’s statement at a parole hearing.
Here is a Facebook page: Justice for Frank. If you can help, please write a letter to the parole board.
Legendary San Francisco police officer Frank Falzon caught the case and describes it in his book:

“Barbaric. Atrocious. Savage. Horrendous.If parole is granted, there will be a full court press on the Governor to deny parole (like for Sirhan).
These are the words used when people talk about what happened at Frank and Annette Carlson's Potrero Hills home on the night of April 18, 1974.
None is adequate. Not even using them all together. Truly, there are no words to describe it. I know I've said it before, as a homicide inspector you never know what you're walking into at a crime scene. But this was beyond the worst ... still rank it among the worst crimes in San Francisco history.”
It’s horrible that my friend has to relive this every few years. Letters to the parole board will help.
Fed: Q4 2022 Household Debt Service Ratio Still Low
by Calculated Risk on 3/26/2023 10:52:00 AM
The Fed's Household Debt Service ratio through Q4 2022 was released last week: Household Debt Service and Financial Obligations Ratios. I used to track this quarterly back in 2005 and 2006 to point out that households were taking on excessive financial obligations.
These ratios show the percent of disposable personal income (DPI) dedicated to debt service (DSR) and financial obligations (FOR) for households. Note: The Fed changed the release in Q3 2013.
The household Debt Service Ratio (DSR) is the ratio of total required household debt payments to total disposable income.This data has limited value in terms of absolute numbers, but is useful in looking at trends. Here is a discussion from the Fed:
The DSR is divided into two parts. The Mortgage DSR is total quarterly required mortgage payments divided by total quarterly disposable personal income. The Consumer DSR is total quarterly scheduled consumer debt payments divided by total quarterly disposable personal income. The Mortgage DSR and the Consumer DSR sum to the DSR.
The limitations of current sources of data make the calculation of the ratio especially difficult. The ideal data set for such a calculation would have the required payments on every loan held by every household in the United States. Such a data set is not available, and thus the calculated series is only an approximation of the debt service ratio faced by households. Nonetheless, this approximation is useful to the extent that, by using the same method and data series over time, it generates a time series that captures the important changes in the household debt service burden.
 Click on graph for larger image.
The graph shows the Total Debt Service Ratio (DSR), and the DSR for mortgages (blue) and consumer debt (yellow).
The Household debt service ratio was at 13.2% in 2007 and has fallen to under 10% now, and the DSR for mortgages (blue) are near the lowest level for the last 35 years.
This data suggests aggregate household cash flow is in a solid position.
Saturday, March 25, 2023
Real Estate Newsletter Articles this Week: "Median Existing Home Prices Declined YoY"
by Calculated Risk on 3/25/2023 02:11:00 PM
At the Calculated Risk Real Estate Newsletter this week:
• NAR: Existing-Home Sales Increased to 4.58 million SAAR in February; Median Prices Declined YoY
• New Home Sales at 640,000 Annual Rate in February
• Final Look at Local Housing Markets in February
• House Prices: Rust or Bust?
• More Good News for Homebuilders
This is usually published 4 to 6 times a week and provides more in-depth analysis of the housing market.
You can subscribe at https://calculatedrisk.substack.com/
Most content is available for free (and no Ads), but please subscribe!
Schedule for Week of March 26, 2023
by Calculated Risk on 3/25/2023 08:11:00 AM
The key reports scheduled for this week include the 3rd estimate of Q4 GDP, February Personal Income & Outlays, and January Case-Shiller house prices.
For manufacturing, the March Dallas and Richmond Fed surveys will be released.
10:30 AM: Dallas Fed Survey of Manufacturing Activity for March.
 9:00 AM: S&P/Case-Shiller House Price Index for January.
This graph shows the year-over-year change for the Case-Shiller National, Composite 10 and Composite 20 indexes, through the most recent report (the Composite 20 was started in January 2000).
The consensus is for a 2.5% year-over-year increase in the Comp 20 index for January, down from 4.6% YoY in December.
9:00 AM: FHFA House Price Index for January 2021. This was originally a GSE only repeat sales, however there is also an expanded index.
10:00 AM: Richmond Fed Survey of Manufacturing Activity for March. This is the last of the regional surveys for March.
7:00 AM ET: The Mortgage Bankers Association (MBA) will release the results for the mortgage purchase applications index.
10:00 AM: Pending Home Sales Index for February. The consensus is for a 3.0% decrease in the index.
8:30 AM, Gross Domestic Product, 4th Quarter and Year 2022 (Third Estimate), GDP by Industry, and Corporate Profits. The consensus is that real GDP increased 2.7% annualized in Q4, unchanged from the second estimate.
8:30 AM: The initial weekly unemployment claims report will be released. The consensus is for 196 thousand initial claims, up from 191 thousand last week.
8:30 AM ET: Personal Income and Outlays for February. The consensus is for a 0.3% increase in personal income, and for a 0.3% increase in personal spending. And for the Core PCE price index to increase 0.4%. PCE prices are expected to be up 5.1% YoY, and core PCE prices up 4.7% YoY.
9:45 AM: Chicago Purchasing Managers Index for March. The consensus is for a reading of 43.6, unchanged from 43.6 in February.
10:00 AM: University of Michigan's Consumer sentiment index (Final for March). The consensus is for a reading of 63.4.
Friday, March 24, 2023
COVID Mar 24, 2023: Update on Cases, Hospitalizations and Deaths
by Calculated Risk on 3/24/2023 09:21:00 PM
 Note: Mortgage rates are from MortgageNewsDaily.com and are for top tier scenarios.
On COVID (focus on hospitalizations and deaths). Data is now weekly.
| COVID Metrics | ||||
|---|---|---|---|---|
| Now | Week Ago | Goal | ||
| New Cases per Week2 | 133,521 | 153,183 | ≤35,0001 | |
| Hospitalized2 | 15,705 | 17,594 | ≤3,0001 | |
| Deaths per Week2🚩 | 2,060 | 1,753 | ≤3501 | |
| 1my goals to stop weekly posts, 2Weekly for Cases, Currently Hospitalized, and Deaths 🚩 Increasing number weekly for Cases, Hospitalized, and Deaths ✅ Goal met. | ||||
 Click on graph for larger image.
This graph shows the weekly (columns) number of deaths reported.
After the first few weeks, the pandemic low for weekly deaths was the week of July 7, 2021, at 1,690 deaths. For cases, the low was 82,186.
For hospitalizations, the low was 9,821.


