by Calculated Risk on 9/20/2023 09:41:00 AM
Wednesday, September 20, 2023
4th Look at Local Housing Markets in August; California Home Sales Down 18.9% YoY in August
Today, in the Calculated Risk Real Estate Newsletter: 4th Look at Local Housing Markets in August
A brief excerpt:
Note: The National Association of Realtors (NAR) is scheduled to release August existing home sales tomorrow, Thursday, September 21st, at 10:00 AM ET. The consensus is the NAR will report sales of 4.10 million SAAR, up from 4.07 million in July.There is much more in the article. You can subscribe at https://calculatedrisk.substack.com/
Housing economist Tom Lawler expects the NAR to report sales of 4.07 million SAAR for August.
...
In August, sales in these markets were down 12.1% YoY. In July, these same markets were down 14.5% YoY Not Seasonally Adjusted (NSA).
This is a slightly smaller YoY decline NSA than in July for these markets. Note that there were the same number of selling days each year in August 2022 and August 2023.
A key factor in the smaller YoY decline was that sales were steadily declining last year due to higher mortgage rates - and sales in August on a seasonally adjusted annual rate (SAAR) basis will likely be close to the July sales rate (4.07 million SAAR).
Several local markets - like Illinois, Miami, New Jersey and New York - will report after the NAR release.
MBA: Mortgage Applications Increased in Weekly Survey
by Calculated Risk on 9/20/2023 07:00:00 AM
From the MBA: Mortgage Applications Increase in Latest MBA Weekly Survey
Mortgage applications increased 5.4 percent from one week earlier, according to data from the Mortgage Bankers Association’s (MBA) Weekly Mortgage Applications Survey for the week ending September 15, 2023. Last week’s results included an adjustment for the Labor Day holiday.
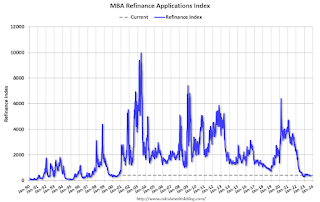
The Market Composite Index, a measure of mortgage loan application volume, increased 5.4 percent on a seasonally adjusted basis from one week earlier. On an unadjusted basis, the Index increased 16 percent compared with the previous week. The Refinance Index increased 13 percent from the previous week and was 29 percent lower than the same week one year ago. The seasonally adjusted Purchase Index increased 2 percent from one week earlier. The unadjusted Purchase Index increased 12 percent compared with the previous week and was 26 percent lower than the same week one year ago.
“Mortgage applications increased last week, despite the 30-year fixed rate edging back up to 7.31 percent – its highest level in four weeks,” said Joel Kan, MBA’s Vice President and Deputy Chief Economist. “Purchase applications increased for conventional and FHA loans over the week but remained 26 percent lower than the same week a year ago, as homebuyers continue to face higher rates and limited for-sale inventory, which have made purchase conditions more challenging. Refinance applications also increased last week but are still almost 30 percent lower than the same week last year.”
Added Kan, “The average loan size on a purchase application was $416,800, the highest level in six weeks. Home prices in many markets have been supported by low inventory and resilient housing demand for available homes.”
...
The average contract interest rate for 30-year fixed-rate mortgages with conforming loan balances ($726,200 or less) increased to 7.31 percent from 7.27 percent, with points remaining unchanged from 0.72 (including the origination fee) for 80 percent loan-to-value ratio (LTV) loans.
emphasis added
 Click on graph for larger image.
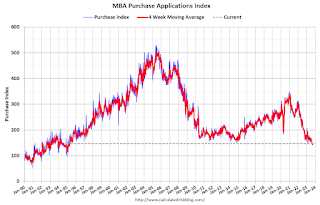
The first graph shows the MBA mortgage purchase index.
According to the MBA, purchase activity is down 26% year-over-year unadjusted.

Tuesday, September 19, 2023
Wednesday: FOMC Statement
by Calculated Risk on 9/19/2023 07:47:00 PM

Wednesday:
• At 7:00 AM ET, The Mortgage Bankers Association (MBA) will release the results for the mortgage purchase applications index.
• During the day, The AIA's Architecture Billings Index for August (a leading indicator for commercial real estate).
• At 2:00 PM, FOMC Meeting Announcement. No change to policy is expected at this meeting.
• At 2:00 PM, FOMC Forecasts This will include the Federal Open Market Committee (FOMC) participants' projections of the appropriate target federal funds rate along with the quarterly economic projections.
• At 2:30 PM, Fed Chair Jerome Powell holds a press briefing following the FOMC announcement.
LA Port Inbound Traffic Down YoY in August
by Calculated Risk on 9/19/2023 01:32:00 PM
Notes: The expansion to the Panama Canal was completed in 2016 (As I noted several years ago), and some of the traffic that used the ports of Los Angeles and Long Beach is probably going through the canal. This might be impacting TEUs on the West Coast.
Container traffic gives us an idea about the volume of goods being exported and imported - and usually some hints about the trade report since LA area ports handle about 40% of the nation's container port traffic.
The following graphs are for inbound and outbound traffic at the ports of Los Angeles and Long Beach in TEUs (TEUs: 20-foot equivalent units or 20-foot-long cargo container).
To remove the strong seasonal component for inbound traffic, the first graph shows the rolling 12-month average.

On a rolling 12-month basis, inbound traffic decreased 0.4% in August compared to the rolling 12 months ending in July. Outbound traffic decreased 0.2% compared to the rolling 12 months ending the previous month.
 Usually imports peak in the July to October period as retailers import goods for the Christmas holiday, and then decline sharply and bottom in February or March depending on the timing of the Chinese New Year.
 August Housing Starts: Near Record Number of Multi-Family Housing Units Under Construction
by Calculated Risk on 9/19/2023 09:23:00 AM
Today, in the CalculatedRisk Real Estate Newsletter: August Housing Starts: Near Record Number of Multi-Family Housing Units Under Construction
Excerpt:
The third graph shows the month-to-month comparison for total starts between 2022 (blue) and 2023 (red).There is much more in the post. You can subscribe at https://calculatedrisk.substack.com/
Total starts were down 14.8% in August compared to August 2022. And starts year-to-date are down 12.5% compared to last year.
Starts have been down year-over-year for 14 of the last 16 months (May and July 2023 were the exceptions), and I expect total starts to be down this year - although the year-over-year comparisons will be easier the rest of the year.
Housing Starts Decreased to 1.283 million Annual Rate in August
by Calculated Risk on 9/19/2023 08:30:00 AM
From the Census Bureau: Permits, Starts and Completions
Housing Starts:
Privately‐owned housing starts in August were at a seasonally adjusted annual rate of 1,283,000. This is 11.3 percent below the revised July estimate of 1,447,000 and is 14.8 percent below the August 2022 rate of 1,505,000. Single‐family housing starts in August were at a rate of 941,000; this is 4.3 percent below the revised July figure of 983,000. The August rate for units in buildings with five units or more was 334,000.
Building Permits:
Privately‐owned housing units authorized by building permits in August were at a seasonally adjusted annual rate of 1,543,000. This is 6.9 percent above the revised July rate of 1,443,000, but is 2.7 percent below the August 2022 rate of 1,586,000. Single‐family authorizations in August were at a rate of 949,000; this is 2.0 percent above the revised July figure of 930,000. Authorizations of units in buildings with five units or more were at a rate of 535,000 in August.
emphasis added
 Click on graph for larger image.
The first graph shows single and multi-family housing starts since 2000.
Multi-family starts (blue, 2+ units) decreased in August compared to July. Multi-family starts were down 41.6% year-over-year in August.
Single-family starts (red) decreased in August and were up 2.4% year-over-year.
 The second graph shows single and multi-family housing starts since 1968.
 This shows the huge collapse following the housing bubble, and then the eventual recovery - and the recent collapse in single-family starts.
Total housing starts in August were well below expectations, however, starts in June and July were revised up, combined.
I'll have more later …
Monday, September 18, 2023
Tuesday: Housing Starts
by Calculated Risk on 9/18/2023 08:10:00 PM

The average lender was only 0.02% higher than Friday this morning, and the improvement brought them 0.01% lower than Friday. These moves are so small that many borrowers would not see any detectable different in mortgage quotes between today and Friday.Tuesday:
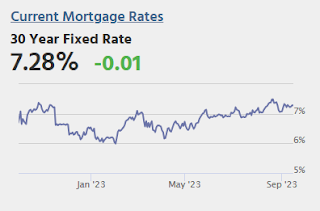
Volatility stands a better chance of increasing on Wednesday afternoon when we get the next rate announcement from the Fed. Even if the Fed doesn't hike rates (and they probably won't), other information released in conjunction with that decision can have a big impact. [30 year fixed 7.28%]
emphasis added
• At 8:30 AM ET, Housing Starts for August. The consensus is for 1.440 million SAAR, down from 1.452 million SAAR.
• At 10:00 AM, State Employment and Unemployment (Monthly) for August 2023
MBA Survey: "Share of Mortgage Loans in Forbearance Decreases to 0.33% in August"
by Calculated Risk on 9/18/2023 04:07:00 PM
From the MBA: Share of Mortgage Loans in Forbearance Decreases to 0.33% in August
The Mortgage Bankers Association’s (MBA) monthly Loan Monitoring Survey revealed that the total number of loans now in forbearance decreased by 6 basis points from 0.39% of servicers’ portfolio volume in the prior month to 0.33% as of August 31, 2023. According to MBA’s estimate, 165,000 homeowners are in forbearance plans. Mortgage servicers have provided forbearance to approximately 7.92 million borrowers since March 2020.
In August, the share of Fannie Mae and Freddie Mac loans in forbearance decreased 1 basis point to 0.19%. Ginnie Mae loans in forbearance decreased 15 basis points to 0.65%, and the forbearance share for portfolio loans and private-label securities (PLS) decreased 6 basis points to 0.39%.
“The forbearance rate is just 8 basis points shy of where it was at the beginning of March 2020, which indicates that most homeowners have recovered from the pandemic,” said Marina Walsh, CMB, MBA’s Vice President of Industry Analysis. “While there was a monthly decline in the performance of post-forbearance workouts in August, overall mortgage servicing portfolios remain resilient. Compared to other credit types with weaker performance, the percentage of home mortgages that are performing is holding steady at a non-seasonally adjusted 96 percent.”
emphasis added
 Click on graph for larger image.
This graph shows the percent of portfolio in forbearance by investor type over time.
The share of forbearance plans has been decreasing and declined to 0.33% in August from 0.39% in July.
At the end of July, there were about 165,000 homeowners in forbearance plans.
Lawler: Early Read on Existing Home Sales in August and Some New Household/Housing Stock Data
by Calculated Risk on 9/18/2023 02:58:00 PM
Today, in the Calculated Risk Real Estate Newsletter: Lawler: Early Read on Existing Home Sales in August and Some New Household/Housing Stock Data
A brief excerpt:
From housing economist Tom Lawler:There is much more in the article. You can subscribe at https://calculatedrisk.substack.com/
Based on publicly-available local realtor/MLS reports released across the country through today, I project that existing home sales as estimated by the National Association of Realtors ran at a seasonally adjusted annual rate of 4.07 million in August, unchanged from July’s preliminary pace and down 14.7 % from last August’s seasonally adjusted pace.
Local realtor/MLS reports suggest that the median existing single-family home sales price last month was up by about 3.8% from last August.
CR Note: The NAR is scheduled to released August Existing Home Sales on Thursday at 10:00 AM ET. The consensus is for 4.10 million SAAR, up from 4.07 million in July.
Cleveland Fed: Median CPI increased 0.3% and Trimmed-mean CPI increased 0.3% in August
by Calculated Risk on 9/18/2023 02:01:00 PM
Note: I didn't update this last week.
According to the Federal Reserve Bank of Cleveland, the median Consumer Price Index rose 0.3% in August. The 16% trimmed-mean Consumer Price Index also increased 0.3% in August. "The median CPI and 16% trimmed-mean CPI are measures of core inflation calculated by the Federal Reserve Bank of Cleveland based on data released in the Bureau of Labor Statistics’ (BLS) monthly CPI report".
 Click on graph for larger image.
This graph shows the year-over-year change for these four key measures of inflation.
Note: The Cleveland Fed released the median CPI details. "Motor Fuel" increased at a 237% annualized rate in August!


