 RSS Feed
 by Calculated Risk on 9/21/2023 05:23:00 PM
Thursday, September 21, 2023
Hotels: Occupancy Rate Decreased 2.2% Year-over-year
U.S. hotel performance increased from the previous week, according to CoStar’s latest data through 16 September. ...The following graph shows the seasonal pattern for the hotel occupancy rate using the four-week average.
10-16 September 2023 (percentage change from comparable week in 2022):
• Occupancy: 67.7% (-2.2%)
• Average daily rate (ADR): US$161.15 (+2.3%)
• Revenue per available room (RevPAR): US$109.07 (+0.1%)
emphasis added
 Click on graph for larger image.
The red line is for 2023, black is 2020, blue is the median, and dashed light blue is for 2022. Dashed purple is for 2018, the record year for hotel occupancy.
The 4-week average of the occupancy rate is tracking just below last year, and slightly above the median rate for the period 2000 through 2022 (Blue).
Note: Y-axis doesn't start at zero to better show the seasonal change.
The 4-week average of the occupancy rate will pick up a little during the Fall.
Realtor.com Reports Weekly Active Inventory Down 4.4% YoY; New Listings Down 6.0% YoY
by Calculated Risk on 9/21/2023 02:00:00 PM
Realtor.com has monthly and weekly data on the existing home market. Here is their weekly report from Sabrina Speianu: Weekly Housing Trends View — Data Week Ending Sep 16, 2023
• Active inventory declined, with for-sale homes lagging behind year ago levels by 4.4%.
During the past week, we observed the 13th successive drop in the number of homes available for sale when compared to the previous year. This decline showed a slight improvement compared to the previous week’s -5.1% figure.
• New listings–a measure of sellers putting homes up for sale–were down again this week, by 6.0% from one year ago.
Over the past 63 weeks, we’ve consistently seen a decline in the number of newly listed homes compared to the same period one year ago. However, this gap in new listings has been gradually narrowing over the past few weeks. This shift comes as the market recovers from more significant declines experienced last year, which were triggered by the steady increase in mortgage rates affecting the real estate landscape.
In the most recent week, the decrease in newly listed homes was 6.0% compared to the previous year, showing improvement from the 7.1% decline in the week prior.
 Here is a graph of the year-over-year change in inventory according to realtor.com.
 Inventory was down 4.4% year-over-year - this was the thirteenth consecutive week with a YoY decrease following 58 consecutive weeks with a YoY increase in inventory.
Inventory is still up from the record lows in the 2nd half of 2021 and early 2022, and it is unlikely we will see new record lows by this measure this year.
NAR: Existing-Home Sales Decreased to 4.04 million SAAR in August; Median Prices Increased 3.9% YoY in August
by Calculated Risk on 9/21/2023 10:49:00 AM
Today, in the CalculatedRisk Real Estate Newsletter: NAR: Existing-Home Sales Decreased to 4.04 million SAAR in August; Median Prices Increased 3.9% YoY in August
Excerpt:
Sales Year-over-Year and Not Seasonally Adjusted (NSA)There is much more in the article. You can subscribe at https://calculatedrisk.substack.com/ Please subscribe!
The fourth graph shows existing home sales by month for 2022 and 2023.
Sales declined 15.3% year-over-year compared to August 2022. This was the twenty-fourth consecutive month with sales down year-over-year. Since sales were declining all year in 2022, the year-over-year declines are getting smaller - even as sales declined over the last 6 months.

NAR: Existing-Home Sales Decreased to 4.04 million SAAR in August
by Calculated Risk on 9/21/2023 10:00:00 AM
From the NAR: Existing-Home Sales Decreased 0.7% in August
Existing-home sales moved lower in August, according to the National Association of REALTORS®. Among the four major U.S. regions, sales improved in the Midwest, were unchanged in the Northeast, and slipped in the South and West. All four regions recorded year-over-year sales declines.
Total existing-home sales – completed transactions that include single-family homes, townhomes, condominiums and co-ops – slid 0.7% from July to a seasonally adjusted annual rate of 4.04 million in August. Year-over-year, sales fell 15.3% (down from 4.77 million in August 2022).
...
Total housing inventory registered at the end of August was 1.1 million units, down 0.9% from July and 14.1% from one year ago (1.28 million). Unsold inventory sits at a 3.3-month supply at the current sales pace, identical to July and up from 3.2 months in August 2022.
emphasis added
 Click on graph for larger image.
This graph shows existing home sales, on a Seasonally Adjusted Annual Rate (SAAR) basis since 1994.
Sales in August (4.04 million SAAR) were down 0.7% from the previous month and were 15.3% below the August 2022 sales rate.
The second graph shows nationwide inventory for existing homes.
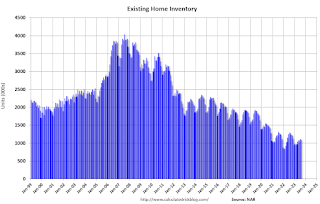 According to the NAR, inventory decreased to 1.10 million in August down from 1.11 million in June.
 According to the NAR, inventory decreased to 1.10 million in August down from 1.11 million in June.
Headline inventory is not seasonally adjusted, and inventory usually decreases to the seasonal lows in December and January, and peaks in mid-to-late summer.
The last graph shows the year-over-year (YoY) change in reported existing home inventory and months-of-supply. Since inventory is not seasonally adjusted, it really helps to look at the YoY change. Note: Months-of-supply is based on the seasonally adjusted sales and not seasonally adjusted inventory.
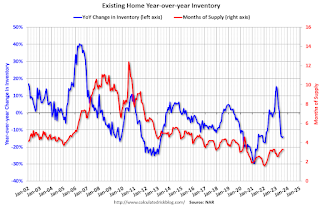 Inventory was down 14.1% year-over-year (blue) in August compared to August 2022.
Months of supply (red) was unchanged at 3.3 months in August from 3.3 months in July.
This was below the consensus forecast. I'll have more later.
The last graph shows the year-over-year (YoY) change in reported existing home inventory and months-of-supply. Since inventory is not seasonally adjusted, it really helps to look at the YoY change. Note: Months-of-supply is based on the seasonally adjusted sales and not seasonally adjusted inventory.
 Inventory was down 14.1% year-over-year (blue) in August compared to August 2022.
 Months of supply (red) was unchanged at 3.3 months in August from 3.3 months in July.
This was below the consensus forecast. I'll have more later.
Weekly Initial Unemployment Claims Decrease to 201,000
by Calculated Risk on 9/21/2023 08:30:00 AM
The DOL reported:
In the week ending September 16, the advance figure for seasonally adjusted initial claims was 201,000, a decrease of 20,000 from the previous week's revised level. The previous week's level was revised up by 1,000 from 220,000 to 221,000. The 4-week moving average was 217,000, a decrease of 7,750 from the previous week's revised average. The previous week's average was revised up by 250 from 224,500 to 224,750.The following graph shows the 4-week moving average of weekly claims since 1971.
emphasis added
 Click on graph for larger image.
The dashed line on the graph is the current 4-week average. The four-week average of weekly unemployment claims decreased to 217,000.
The previous week was revised up.
Weekly claims were lower than the consensus forecast.
Wednesday, September 20, 2023
Thursday: Existing Home Sales, Unemployment Claims, Philly Fed Mfg
by Calculated Risk on 9/20/2023 08:36:00 PM
 Note: Mortgage rates are from MortgageNewsDaily.com and are for top tier scenarios.
Thursday:
• At 8:30 AM ET, The initial weekly unemployment claims report will be released. The consensus is for 224 thousand initial claims, up from 220 thousand last week.
• At 8:30 AM, the Philly Fed manufacturing survey for September. The consensus is for a reading of 0.0, up from -12.0.
• At 10:00 AM, Existing Home Sales for August from the National Association of Realtors (NAR). The consensus is for 4.10 million SAAR, up from 4.07 million in July.
FOMC Projections and Press Conference
by Calculated Risk on 9/20/2023 02:17:00 PM
Statement here.
Fed Chair Powell press conference video here or on YouTube here, starting at 2:30 PM ET.
Here are the projections. Projections of the neutral Fed Funds rate increased again!
In June, the FOMC participants’ midpoint of the target level for the federal funds rate was at 5.625% at the end of 2023. The FOMC participants’ midpoint of the target range is now closer to 5.5% and declines to 5.125% in 2024.
1 Projections of change in real GDP and inflation are from the fourth quarter of the previous year to the fourth quarter of the year indicated.
The unemployment rate was at 3.8% in August. The FOMC's unemployment rate projection for Q4 was revised down.
2 Projections for the unemployment rate are for the average civilian unemployment rate in the fourth quarter of the year indicated.
As of July 2023, PCE inflation increased 3.3 percent year-over-year (YoY), up from 3.0 percent YoY in June, and down from the recent peak of 7.0 percent in June 2022. Projections for PCE inflation were mostly unchanged.
PCE core inflation increased 4.2 percent YoY, up from 4.1 percent in June, and down from the recent peak of 5.4 percent in February 2022. This includes PCE measure of shelter that was up 7.8% YoY in July (even though asking rents are soft). Core PCE inflation likely declined to around 3.8% in August, and the FOMC revised down their projections.
The BEA reported real GDP increased at a 2.1% annual rate in Q2, after increasing at a 2.0% annual rate in Q1. And real GDP is increasing around 3.0% annualized in Q3. Even with slower growth in Q4 - partially due to the likely government shutdown, the UAW strike, student loan payments, and higher oil prices, the FOMC projections for year-over-year growth in Q4 2023 was revised up sharply.
| GDP projections of Federal Reserve Governors and Reserve Bank presidents, Change in Real GDP1 | ||||
|---|---|---|---|---|
| Projection Date | 2023 | 2024 | 2025 | |
| Sept 2023 | 1.9 to 2.2 | 1.2 to 1.8 | 1.6 to 2.0 | |
| June 2023 | 0.7 to 1.2 | 0.9 to 1.5 | 1.6 to 2.0 | |
The unemployment rate was at 3.8% in August. The FOMC's unemployment rate projection for Q4 was revised down.
| Unemployment projections of Federal Reserve Governors and Reserve Bank presidents, Unemployment Rate2 | ||||
|---|---|---|---|---|
| Projection Date | 2023 | 2024 | 2025 | |
| Sept 2023 | 3.7 to 3.9 | 3.9 to 4.4 | 3.9 to 4.3 | |
| June 2023 | 4.0 to 4.3 | 4.3 to 4.6 | 4.3 to 4.6 | |
As of July 2023, PCE inflation increased 3.3 percent year-over-year (YoY), up from 3.0 percent YoY in June, and down from the recent peak of 7.0 percent in June 2022. Projections for PCE inflation were mostly unchanged.
| Inflation projections of Federal Reserve Governors and Reserve Bank presidents, PCE Inflation1 | ||||
|---|---|---|---|---|
| Projection Date | 2023 | 2024 | 2025 | |
| Sept 2023 | 3.2 to 3.4 | 2.3 to 2.7 | 2.0 to 2.3 | |
| June 2023 | 3.0 to 3.5 | 2.3 to 2.8 | 2.0 to 2.4 | |
PCE core inflation increased 4.2 percent YoY, up from 4.1 percent in June, and down from the recent peak of 5.4 percent in February 2022. This includes PCE measure of shelter that was up 7.8% YoY in July (even though asking rents are soft). Core PCE inflation likely declined to around 3.8% in August, and the FOMC revised down their projections.
| Core Inflation projections of Federal Reserve Governors and Reserve Bank presidents, Core Inflation1 | ||||
|---|---|---|---|---|
| Projection Date | 2023 | 2024 | 2025 | |
| Sept 2023 | 3.6 to 3.9 | 2.5 to 2.8 | 2.0 to 2.4 | |
| June 2023 | 3.7 to 4.2 | 2.5 to 3.1 | 2.0 to 2.4 | |
FOMC Statement: No Change to Rates
by Calculated Risk on 9/20/2023 02:00:00 PM
Fed Chair Powell press conference video here or on YouTube here, starting at 2:30 PM ET.
FOMC Statement:
Recent indicators suggest that economic activity has been expanding at a solid pace. Job gains have slowed in recent months but remain strong, and the unemployment rate has remained low. Inflation remains elevated.
The U.S. banking system is sound and resilient. Tighter credit conditions for households and businesses are likely to weigh on economic activity, hiring, and inflation. The extent of these effects remains uncertain. The Committee remains highly attentive to inflation risks.
The Committee seeks to achieve maximum employment and inflation at the rate of 2 percent over the longer run. In support of these goals, the Committee decided to maintain the target range for the federal funds rate at 5-1/4 to 5-1/2 percent. The Committee will continue to assess additional information and its implications for monetary policy. In determining the extent of additional policy firming that may be appropriate to return inflation to 2 percent over time, the Committee will take into account the cumulative tightening of monetary policy, the lags with which monetary policy affects economic activity and inflation, and economic and financial developments. In addition, the Committee will continue reducing its holdings of Treasury securities and agency debt and agency mortgage-backed securities, as described in its previously announced plans. The Committee is strongly committed to returning inflation to its 2 percent objective.
In assessing the appropriate stance of monetary policy, the Committee will continue to monitor the implications of incoming information for the economic outlook. The Committee would be prepared to adjust the stance of monetary policy as appropriate if risks emerge that could impede the attainment of the Committee's goals. The Committee's assessments will take into account a wide range of information, including readings on labor market conditions, inflation pressures and inflation expectations, and financial and international developments.
Voting for the monetary policy action were Jerome H. Powell, Chair; John C. Williams, Vice Chair; Michael S. Barr; Michelle W. Bowman; Lisa D. Cook; Austan D. Goolsbee; Patrick Harker; Philip N. Jefferson; Neel Kashkari; Adriana D. Kugler; Lorie K. Logan; and Christopher J. Waller.
emphasis added
AIA: Architecture Billings "Softening Business Conditions in August"; Multi-family Billings Decline for 13th Consecutive Month
by Calculated Risk on 9/20/2023 11:46:00 AM
Note: This index is a leading indicator primarily for new Commercial Real Estate (CRE) investment.
From the AIA: AIA/Deltek Architecture Billings Index Sees Softening Business Conditions in August
The AIA/Deltek Architecture Billings Index (ABI) eased modestly in August, with a score of 48.1, marking the eleventh consecutive month of essentially flat billings at architecture firms. Any score below 50.0 indicates decreasing business conditions. This follows a period of robust growth in 2021 and 2022. While inquiries into new projects remained relatively strong in August, the value of newly signed design contracts declined for the first time since April, indicating that fewer clients signed contracts for new projects than in the prior three months.
“Business conditions at architecture firms continue to be sluggish,” said Kermit Baker, PhD, AIA Chief Economist. “New project work coming into architecture firms as well ongoing project activity remain stalled in a relatively narrow range and exhibit very little month-to-month variation. Through this pause has taken pressure off tight staffing conditions across the profession, there is considerable uncertainty over the direction of future activity.”
Business conditions also remained soft at firms with a multifamily residential specialization and declined modestly at firms with an institutional specialization. However, firms with a commercial/industrial specialization reported billings growth for the third month in a row in August.
...
• Regional averages: Northeast (50.6); South (49.9); Midwest (48.1); West (45.8)
• Sector index breakdown: commercial/industrial (51.5); institutional (49.4); mixed practice (firms that do not have at least half of their billings in any one other category) (46.9); multifamily residential (44.1)
emphasis added
 Click on graph for larger image.
This graph shows the Architecture Billings Index since 1996. The index was at 48.1 in July, down from 50.0 in July. Anything below 50 indicates a decrease in demand for architects' services.
Note: This includes commercial and industrial facilities like hotels and office buildings, multi-family residential, as well as schools, hospitals and other institutions.
This index usually leads CRE investment by 9 to 12 months, so this index suggests a slowdown in CRE investment into 2024.
Note that multi-family billing turned down in August 2022 and has been negative for thirteen consecutive months (with revisions). This suggests we will see a further weakness in multi-family starts.
4th Look at Local Housing Markets in August; California Home Sales Down 18.9% YoY in August
by Calculated Risk on 9/20/2023 09:41:00 AM
Today, in the Calculated Risk Real Estate Newsletter: 4th Look at Local Housing Markets in August
A brief excerpt:
Note: The National Association of Realtors (NAR) is scheduled to release August existing home sales tomorrow, Thursday, September 21st, at 10:00 AM ET. The consensus is the NAR will report sales of 4.10 million SAAR, up from 4.07 million in July.There is much more in the article. You can subscribe at https://calculatedrisk.substack.com/
Housing economist Tom Lawler expects the NAR to report sales of 4.07 million SAAR for August.
...
In August, sales in these markets were down 12.1% YoY. In July, these same markets were down 14.5% YoY Not Seasonally Adjusted (NSA).
This is a slightly smaller YoY decline NSA than in July for these markets. Note that there were the same number of selling days each year in August 2022 and August 2023.
A key factor in the smaller YoY decline was that sales were steadily declining last year due to higher mortgage rates - and sales in August on a seasonally adjusted annual rate (SAAR) basis will likely be close to the July sales rate (4.07 million SAAR).
Several local markets - like Illinois, Miami, New Jersey and New York - will report after the NAR release.


