 RSS Feed
 by Calculated Risk on 9/22/2023 12:59:00 PM
Friday, September 22, 2023
Philly Fed: State Coincident Indexes Increased in 40 States in August (3-Month Basis)
From the Philly Fed:
The Federal Reserve Bank of Philadelphia has released the coincident indexes for the 50 states for August 2023. Over the past three months, the indexes increased in 40 states, decreased in eight states, and remained stable in two, for a three-month diffusion index of 64. Additionally, in the past month, the indexes increased in 30 states, decreased in 13 states, and remained stable in seven, for a one-month diffusion index of 34. For comparison purposes, the Philadelphia Fed has also developed a similar coincident index for the entire United States. The Philadelphia Fed’s U.S. index increased 0.6 percent over the past three months and 0.1 percent in August.Note: These are coincident indexes constructed from state employment data. An explanation from the Philly Fed:
emphasis added
The coincident indexes combine four state-level indicators to summarize current economic conditions in a single statistic. The four state-level variables in each coincident index are nonfarm payroll employment, average hours worked in manufacturing by production workers, the unemployment rate, and wage and salary disbursements deflated by the consumer price index (U.S. city average). The trend for each state’s index is set to the trend of its gross domestic product (GDP), so long-term growth in the state’s index matches long-term growth in its GDP.
 Click on map for larger image.
Here is a map of the three-month change in the Philly Fed state coincident indicators. This map was all red during the worst of the Pandemic and also at the worst of the Great Recession.
The map is mostly positive on a three-month basis.
Source: Philly Fed.
 And here is a graph is of the number of states with one month increasing activity according to the Philly Fed.
 This graph includes states with minor increases (the Philly Fed lists as unchanged).
In August, 33 states had increasing activity including minor increases.
In August, 33 states had increasing activity including minor increases.
September Vehicle Sales Forecast: 15.4 million SAAR, Up Sharply YoY
by Calculated Risk on 9/22/2023 09:56:00 AM
From WardsAuto: September U.S. Light-Vehicle Sales Heading for Strong Year-Over-Year Gain Despite Strike Impact (pay content). Brief excerpt:
The possibility in September that other automakers will benefit much from buyers defecting from the Detroit 3 brands is negligible. The vehicles currently impacted by shutdowns either are products with high brand loyalty, in segments dominated by the three strike-impacted manufacturers or have plenty of inventory.
emphasis added
 Click on graph for larger image.
This graph shows actual sales from the BEA (Blue), and Wards forecast for September (Red).
On a seasonally adjusted annual rate basis, the Wards forecast of 15.4 million SAAR, would be up 2% from last month, and up 13% from a year ago.
Vehicle sales are usually a transmission mechanism for Federal Open Market Committee (FOMC) policy, although far behind housing. This time vehicle sales were more suppressed by supply chain issues and have picked up recently.
Q3 GDP Tracking: Around 3%
by Calculated Risk on 9/22/2023 08:28:00 AM
From BofA:
Overall, the data flow since our last report left our 3Q and 2Q US GDP tracking unchanged at 2.9% q/q saar and 2.3% q/q saar, respectively. [Sept 22nd estimate]From Goldman:
emphasis added
We left our Q3 GDP tracking estimate unchanged at +3.2% (qoq ar). [Sept 21st estimate]And from the Altanta Fed: GDPNow
The GDPNow model estimate for real GDP growth (seasonally adjusted annual rate) in the third quarter of 2023 is 4.9 percent on September 19, unchanged from September 14 after rounding. After recent releases from the US Census Bureau and the US Bureau of Labor Statistics, the nowcast of third-quarter real residential investment growth decreased from 6.8 percent to 6.3 percent, while the nowcast of the contribution of inventory investment to third-quarter real GDP growth decreased from 1.20 percentage points to 1.05 percentage points. [Sept 19th estimate]
Thursday, September 21, 2023
"Mortgage Rates Jump up to 23-Year Highs"
by Calculated Risk on 9/21/2023 08:15:00 PM
 From Matthew Graham at Mortgage News Daily: Mortgage Rates Jump up to 23-Year Highs
Between the data and the overnight momentum in overseas markets, bonds are at their weakest levels in years. Mortgage-backed securities (the bonds that dictate mortgage rates) didn't swoon quite as much as Treasuries, but as of today, it was just enough to push the average mortgage lender almost perfectly back in line with the highest 30yr fixed rate of the past 23 years. [30 year fixed 7.47%]Friday:
emphasis added
• No major economic releases scheduled.
Hotels: Occupancy Rate Decreased 2.2% Year-over-year
by Calculated Risk on 9/21/2023 05:23:00 PM
U.S. hotel performance increased from the previous week, according to CoStar’s latest data through 16 September. ...The following graph shows the seasonal pattern for the hotel occupancy rate using the four-week average.
10-16 September 2023 (percentage change from comparable week in 2022):
• Occupancy: 67.7% (-2.2%)
• Average daily rate (ADR): US$161.15 (+2.3%)
• Revenue per available room (RevPAR): US$109.07 (+0.1%)
emphasis added
 Click on graph for larger image.
The red line is for 2023, black is 2020, blue is the median, and dashed light blue is for 2022. Dashed purple is for 2018, the record year for hotel occupancy.
The 4-week average of the occupancy rate is tracking just below last year, and slightly above the median rate for the period 2000 through 2022 (Blue).
Note: Y-axis doesn't start at zero to better show the seasonal change.
The 4-week average of the occupancy rate will pick up a little during the Fall.
Realtor.com Reports Weekly Active Inventory Down 4.4% YoY; New Listings Down 6.0% YoY
by Calculated Risk on 9/21/2023 02:00:00 PM
Realtor.com has monthly and weekly data on the existing home market. Here is their weekly report from Sabrina Speianu: Weekly Housing Trends View — Data Week Ending Sep 16, 2023
• Active inventory declined, with for-sale homes lagging behind year ago levels by 4.4%.
During the past week, we observed the 13th successive drop in the number of homes available for sale when compared to the previous year. This decline showed a slight improvement compared to the previous week’s -5.1% figure.
• New listings–a measure of sellers putting homes up for sale–were down again this week, by 6.0% from one year ago.
Over the past 63 weeks, we’ve consistently seen a decline in the number of newly listed homes compared to the same period one year ago. However, this gap in new listings has been gradually narrowing over the past few weeks. This shift comes as the market recovers from more significant declines experienced last year, which were triggered by the steady increase in mortgage rates affecting the real estate landscape.
In the most recent week, the decrease in newly listed homes was 6.0% compared to the previous year, showing improvement from the 7.1% decline in the week prior.
 Here is a graph of the year-over-year change in inventory according to realtor.com.
 Inventory was down 4.4% year-over-year - this was the thirteenth consecutive week with a YoY decrease following 58 consecutive weeks with a YoY increase in inventory.
Inventory is still up from the record lows in the 2nd half of 2021 and early 2022, and it is unlikely we will see new record lows by this measure this year.
NAR: Existing-Home Sales Decreased to 4.04 million SAAR in August; Median Prices Increased 3.9% YoY in August
by Calculated Risk on 9/21/2023 10:49:00 AM
Today, in the CalculatedRisk Real Estate Newsletter: NAR: Existing-Home Sales Decreased to 4.04 million SAAR in August; Median Prices Increased 3.9% YoY in August
Excerpt:
Sales Year-over-Year and Not Seasonally Adjusted (NSA)There is much more in the article. You can subscribe at https://calculatedrisk.substack.com/ Please subscribe!
The fourth graph shows existing home sales by month for 2022 and 2023.
Sales declined 15.3% year-over-year compared to August 2022. This was the twenty-fourth consecutive month with sales down year-over-year. Since sales were declining all year in 2022, the year-over-year declines are getting smaller - even as sales declined over the last 6 months.

NAR: Existing-Home Sales Decreased to 4.04 million SAAR in August
by Calculated Risk on 9/21/2023 10:00:00 AM
From the NAR: Existing-Home Sales Decreased 0.7% in August
Existing-home sales moved lower in August, according to the National Association of REALTORS®. Among the four major U.S. regions, sales improved in the Midwest, were unchanged in the Northeast, and slipped in the South and West. All four regions recorded year-over-year sales declines.
Total existing-home sales – completed transactions that include single-family homes, townhomes, condominiums and co-ops – slid 0.7% from July to a seasonally adjusted annual rate of 4.04 million in August. Year-over-year, sales fell 15.3% (down from 4.77 million in August 2022).
...
Total housing inventory registered at the end of August was 1.1 million units, down 0.9% from July and 14.1% from one year ago (1.28 million). Unsold inventory sits at a 3.3-month supply at the current sales pace, identical to July and up from 3.2 months in August 2022.
emphasis added
 Click on graph for larger image.
This graph shows existing home sales, on a Seasonally Adjusted Annual Rate (SAAR) basis since 1994.
Sales in August (4.04 million SAAR) were down 0.7% from the previous month and were 15.3% below the August 2022 sales rate.
The second graph shows nationwide inventory for existing homes.
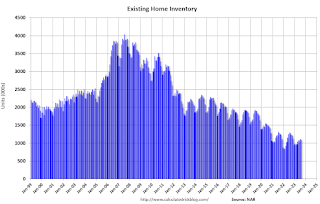 According to the NAR, inventory decreased to 1.10 million in August down from 1.11 million in June.
 According to the NAR, inventory decreased to 1.10 million in August down from 1.11 million in June.
Headline inventory is not seasonally adjusted, and inventory usually decreases to the seasonal lows in December and January, and peaks in mid-to-late summer.
The last graph shows the year-over-year (YoY) change in reported existing home inventory and months-of-supply. Since inventory is not seasonally adjusted, it really helps to look at the YoY change. Note: Months-of-supply is based on the seasonally adjusted sales and not seasonally adjusted inventory.
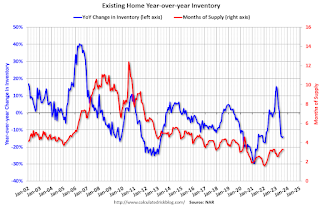 Inventory was down 14.1% year-over-year (blue) in August compared to August 2022.
Months of supply (red) was unchanged at 3.3 months in August from 3.3 months in July.
This was below the consensus forecast. I'll have more later.
The last graph shows the year-over-year (YoY) change in reported existing home inventory and months-of-supply. Since inventory is not seasonally adjusted, it really helps to look at the YoY change. Note: Months-of-supply is based on the seasonally adjusted sales and not seasonally adjusted inventory.
 Inventory was down 14.1% year-over-year (blue) in August compared to August 2022.
 Months of supply (red) was unchanged at 3.3 months in August from 3.3 months in July.
This was below the consensus forecast. I'll have more later.
Weekly Initial Unemployment Claims Decrease to 201,000
by Calculated Risk on 9/21/2023 08:30:00 AM
The DOL reported:
In the week ending September 16, the advance figure for seasonally adjusted initial claims was 201,000, a decrease of 20,000 from the previous week's revised level. The previous week's level was revised up by 1,000 from 220,000 to 221,000. The 4-week moving average was 217,000, a decrease of 7,750 from the previous week's revised average. The previous week's average was revised up by 250 from 224,500 to 224,750.The following graph shows the 4-week moving average of weekly claims since 1971.
emphasis added
 Click on graph for larger image.
The dashed line on the graph is the current 4-week average. The four-week average of weekly unemployment claims decreased to 217,000.
The previous week was revised up.
Weekly claims were lower than the consensus forecast.
Wednesday, September 20, 2023
Thursday: Existing Home Sales, Unemployment Claims, Philly Fed Mfg
by Calculated Risk on 9/20/2023 08:36:00 PM
 Note: Mortgage rates are from MortgageNewsDaily.com and are for top tier scenarios.
Thursday:
• At 8:30 AM ET, The initial weekly unemployment claims report will be released. The consensus is for 224 thousand initial claims, up from 220 thousand last week.
• At 8:30 AM, the Philly Fed manufacturing survey for September. The consensus is for a reading of 0.0, up from -12.0.
• At 10:00 AM, Existing Home Sales for August from the National Association of Realtors (NAR). The consensus is for 4.10 million SAAR, up from 4.07 million in July.


