 RSS Feed
 by Calculated Risk on 12/29/2023 08:35:00 AM
Friday, December 29, 2023
Question #10 for 2024: Will inventory increase further in 2024?
Today, in the Real Estate Newsletter: Question #10 for 2024: Will inventory increase further in 2024?
Brief excerpt:
Earlier I posted some questions on my blog for next year: Ten Economic Questions for 2024. Some of these questions concern real estate (inventory, house prices, housing starts, new home sales), and I’ll post thoughts on those in the newsletter (others like GDP and employment will be on my blog).There is much more in the article. You can subscribe at https://calculatedrisk.substack.com/
I'm adding some thoughts, and maybe some predictions for each question.
10) Housing Inventory: Housing inventory decreased sharply during the pandemic to record lows in early 2022. Since then, inventory has increased, but is still well below pre-pandemic levels. Will inventory increase further in 2024?
...
First, a brief history. Here are a few times when watching existing home inventory helped my analysis.
Starting in January 2005, I was very bearish on housing, but I wasn’t sure when the market would turn. Speculative bubbles can go on and on. However, the increase in inventory in late 2005 (see red arrow on graph) helped me call the top for house prices in 2006.Several years later, in early 2012, when many people were still bearish on housing, the plunge in inventory in 2011 (blue arrow on graph below) helped me call the bottom for house prices in early 2012 (see The Housing Bottom is Here).
...
Somewhat lower mortgage rates - and time - will likely lead to more new listings in 2024. Still, mortgage rates will remain well above the pandemic lows, and therefore new listings will be depressed again in 2024.
The bottom line is inventory will probably increase year-over-year in 2024. However, it seems unlikely that inventory will be back up to the 2019 levels. Inventory is always something to watch!

Thursday, December 28, 2023
Friday: Chicago PMI
by Calculated Risk on 12/28/2023 08:22:00 PM
 Note: Mortgage rates are from MortgageNewsDaily.com and are for top tier scenarios.
Friday:
• At 9:45 AM: Chicago Purchasing Managers Index for December.
Hotels: Occupancy Rate Increased 0.5% Year-over-year
by Calculated Risk on 12/28/2023 03:11:00 PM
As anticipated ahead of the holidays, U.S. hotel performance fell from the previous week, according to CoStar’s latest data through 23 December. ...The following graph shows the seasonal pattern for the hotel occupancy rate using the four-week average.
17-23 December 2023 (percentage change from comparable week in 2022):
• Occupancy: 43.9% (+0.5%)
• Average daily rate (ADR): US$131.97 (-0.9%)
• Revenue per available room (RevPAR): US$57.90 (-0.4%)
emphasis added
 Click on graph for larger image.
The red line is for 2023, black is 2020, blue is the median, and dashed light blue is for 2022. Dashed purple is for 2018, the record year for hotel occupancy.
The 4-week average of the occupancy rate is tracking close to last year, and above the median rate for the period 2000 through 2022 (Blue).
Note: Y-axis doesn't start at zero to better show the seasonal change.
The 4-week average of the occupancy rate will start increasing seasonally in the new year.
Las Vegas November 2023: Visitor Traffic Up 1% YoY; Convention Traffic Up 3%
by Calculated Risk on 12/28/2023 01:54:00 PM
From the Las Vegas Visitor Authority: November 2023 Las Vegas Visitor Statistics
With highlights including the SEMA tradeshow in the first week of the month and of course, the inaugural Formula 1 Las Vegas Grand Prix on Nov 16‐18, Las Vegas tourism metrics exceeded last November across several categories, most notably with record ADR and RevPAR.
Visitor volume exceeded 3.29M, ahead of last November by +0.8%, and convention attendance approached 600k, +2.7% YoY.
Overall hotel occupancy was 81.9%, +0.7 pts YoY, as Weekend occupancy reached 88.7% (‐0.9 pts YoY) while Midweek occupancy exceeded last November by 1.4 pts to reach 78.9% for the month. Driven by strong rates during the dates of the F1 race, monthly ADR reached a record $249, +33.7% YoY and RevPAR exceeded $204, +34.8% YoY
 Click on graph for larger image.
 The first graph shows visitor traffic for 2019 (Black), 2020 (light blue), 2021 (purple), 2022 (orange), and 2023 (red).
Visitor traffic was up 0.8% compared to last November.
Visitor traffic was down 6.2% compared to the same month in 2019.
Note: There was almost no convention traffic from April 2020 through May 2021.
The second graph shows convention traffic.
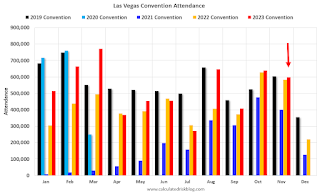
Convention traffic was up 2.7% compared to November 2022, and down 0.8% compared to November 2019.
Note: There was almost no convention traffic from April 2020 through May 2021.
Update on FirstAm Cyber Attack
by Calculated Risk on 12/28/2023 01:42:00 PM
Update on FirstAm cyber attack (started on Dec 20th). This will impact December house closings. From FirstAm:
"FirstAm.com has been restored (with some limits to functionality). We will continue to post updates on this page as we return to normal business operations."
NAR: Pending Home Sales Unchanged in November; Down 5.2% Year-over-year
by Calculated Risk on 12/28/2023 10:00:00 AM
From the NAR: Pending Home Sales Recorded No Change in November
Pending home sales in November were identical to those in October, according to the National Association of REALTORS®. The Northeast, Midwest and West posted monthly gains in transactions while the South recorded a loss. All four U.S. regions registered year-over-year declines in transactions.This was below expectations. Note: Contract signings usually lead sales by about 45 to 60 days, so this would usually be for closed sales in December and January.
The Pending Home Sales Index (PHSI)* – a forward-looking indicator of home sales based on contract signings – stayed at 71.6 in November. Year over year, pending transactions were down 5.2%. An index of 100 is equal to the level of contract activity in 2001.
...
The Northeast PHSI rose 0.8% from last month to 64.4, a drop of 6.4% from November 2022. The Midwest index increased 0.5% to 76.2 in November, down 2.2% from one year ago.
The South PHSI declined 2.3% to 83.2 in November, decreasing 6.5% from the prior year. The West index climbed 4.2% in November to 54.0, falling 4.9% from November 2022.
emphasis added
Weekly Initial Unemployment Claims Increase to 218,000
by Calculated Risk on 12/28/2023 08:30:00 AM
The DOL reported:
In the week ending December 23, the advance figure for seasonally adjusted initial claims was 218,000, an increase of 12,000 from the previous week's revised level. The previous week's level was revised up by 1,000 from 205,000 to 206,000. The 4-week moving average was 212,000, a decrease of 250 from the previous week's revised average. The previous week's average was revised up by 250 from 212,000 to 212,250.The following graph shows the 4-week moving average of weekly claims since 1971.
emphasis added
 Click on graph for larger image.
The dashed line on the graph is the current 4-week average. The four-week average of weekly unemployment claims decreased to 212,000.
The previous week was revised up.
Weekly claims were above the consensus forecast.
Wednesday, December 27, 2023
Thursday: Unemployment Claims, Pending Home Sales
by Calculated Risk on 12/27/2023 06:46:00 PM
 Note: Mortgage rates are from MortgageNewsDaily.com and are for top tier scenarios.
Thursday:
• At 8:30 AM ET, The initial weekly unemployment claims report will be released. The consensus is for 210 thousand, up from 205 thousand last week.
• At 10:00 AM, Pending Home Sales Index for November. The consensus is for a 0.9% increase in the index.
Inflation Adjusted House Prices 2.4% Below Peak; Price-to-rent index is 6.7% below recent peak
by Calculated Risk on 12/27/2023 11:55:00 AM
Today, in the Calculated Risk Real Estate Newsletter: Inflation Adjusted House Prices 2.4% Below Peak; Price-to-rent index is 6.7% below recent peak
Excerpt:
It has been over 17 years since the bubble peak. In the October Case-Shiller house price index released yesterday, the seasonally adjusted National Index (SA), was reported as being 70% above the bubble peak in 2006. However, in real terms, the National index (SA) is about 10% above the bubble peak (and historically there has been an upward slope to real house prices). The composite 20, in real terms, is 1% above the bubble peak.
People usually graph nominal house prices, but it is also important to look at prices in real terms. As an example, if a house price was $300,000 in January 2010, the price would be $424,000 today adjusted for inflation (41% increase). That is why the second graph below is important - this shows "real" prices.
The third graph shows the price-to-rent ratio, and the fourth graph is the affordability index. The last graph shows the 5-year real return based on the Case-Shiller National Index.
...
The second graph shows the same two indexes in real terms (adjusted for inflation using CPI).
In real terms (using CPI), the National index is 2.4% below the recent peak, and the Composite 20 index is 3.3% below the recent peak in 2022.
In real terms, national house prices are 10.3% above the bubble peak levels. There is an upward slope to real house prices, and it has been about 17 years since the previous peak, but real prices are historically high.

There is much more in the article. You can subscribe at https://calculatedrisk.substack.com/
Fannie and Freddie Serious Delinquencies in November: Single Family Mostly Unchanged, Multi-Family Increased
by Calculated Risk on 12/27/2023 08:19:00 AM
Today, in the Calculated Risk Real Estate Newsletter: Fannie and Freddie Serious Delinquencies in November: Single Family Mostly Unchanged, Multi-Family Increased
Brief excerpt:
Single-family serious delinquencies were mostly unchanged in November, however, multi-family serious delinquencies increased.You can subscribe at https://calculatedrisk.substack.com/.
...
Freddie Mac reports that multi-family delinquencies increased to 0.28% in November, up from 0.15% in November 2022.
This graph shows the Freddie multi-family serious delinquency rate since 2012. Rates were still high in 2012 following the housing bust and financial crisis.
The multi-family rate increased following the pandemic and has increased recently as rent growth has slowed, vacancy rates have increased, and interest rates have increased sharply. This will be something to watch as rents soften, and more apartments come on the market.


