 RSS Feed
 by Calculated Risk on 1/03/2025 02:01:00 PM
Friday, January 03, 2025
Q4 GDP Tracking: around 2.4%
From Goldman:
We left our Q4 GDP tracking estimate unchanged at +2.3% (quarter-over-quarter annualized) and our Q4 domestic final sales forecast unchanged at +2.3%. [Jan 2nd estimate]And from the Atlanta Fed: GDPNow
emphasis added
The GDPNow model estimate for real GDP growth (seasonally adjusted annual rate) in the fourth quarter of 2024 is 2.4 percent on January 3, down from 2.6 percent on January 2. After this morning’s Manufacturing ISM Report on Business from the Institute for Supply Management, the nowcasts of fourth-quarter real personal consumption expenditures growth and fourth-quarter real gross private domestic investment growth decreased from 3.2 percent and -0.7 percent, respectively, to 3.0 percent and -0.9 percent. [Jan 3rd estimate]
Inflation Adjusted House Prices 1.3% Below 2022 Peak; Price-to-rent index is 8.1% below 2022 peak
by Calculated Risk on 1/03/2025 10:37:00 AM
Today, in the Calculated Risk Real Estate Newsletter: Inflation Adjusted House Prices 1.3% Below 2022 Peak
Excerpt:
It has been over 18 years since the housing bubble peak. In the October Case-Shiller house price index released earlier this week, the seasonally adjusted National Index (SA), was reported as being 76% above the bubble peak in 2006. However, in real terms, the National index (SA) is about 11% above the bubble peak (and historically there has been an upward slope to real house prices). The composite 20, in real terms, is 3% above the bubble peak.There is much more in the article!
People usually graph nominal house prices, but it is also important to look at prices in real terms. As an example, if a house price was $300,000 in January 2010, the price would be $435,000 today adjusted for inflation (45% increase). That is why the second graph below is important - this shows "real" prices.
The third graph shows the price-to-rent ratio, and the fourth graph is the affordability index. The last graph shows the 5-year real return based on the Case-Shiller National Index.
...
The second graph shows the same two indexes in real terms (adjusted for inflation using CPI).
In real terms (using CPI), the National index is 1.3% below the recent peak, and the Composite 20 index is 1.5% below the recent peak in 2022. The real National index and the Composite 20 index increased slightly in real terms in October.
It has now been 29 months since the real peak in house prices. Typically, after a sharp increase in prices, it takes a number of years for real prices to reach new highs (see House Prices: 7 Years in Purgatory)

ISM® Manufacturing index Increased to 49.3% in December
by Calculated Risk on 1/03/2025 10:00:00 AM
(Posted with permission). The ISM manufacturing index indicated contraction. The PMI® was at 49.3% in December, up from 48.4% in November. The employment index was at 45.3%, down from 48.1% the previous month, and the new orders index was at 52.5%, up from 50.4%.
From ISM: Manufacturing PMI® at 49.3% December 2024 Manufacturing ISM® Report On Business®
Economic activity in the manufacturing sector contracted in December for the ninth consecutive month and the 25th time in the last 26 months, say the nation's supply executives in the latest Manufacturing ISM® Report On Business®.This suggests manufacturing contracted in December. This was above the consensus forecast.
The report was issued today by Timothy R. Fiore, CPSM, C.P.M., Chair of the Institute for Supply Management® (ISM®) Manufacturing Business Survey Committee:
“The Manufacturing PMI® registered 49.3 percent in December, 0.9 percentage point higher compared to the 48.4 percent recorded in November. The overall economy continued in expansion for the 56th month after one month of contraction in April 2020. (A Manufacturing PMI® above 42.5 percent, over a period of time, generally indicates an expansion of the overall economy.) The New Orders Index continued in expansion territory for the second month after seven months of contraction, strengthening to 52.5 percent, 2.1 percentage points higher than the 50.4 percent recorded in November. The December reading of the Production Index (50.3 percent) is 3.5 percentage points higher than November’s figure of 46.8 percent. The index returned to expansion after six months in contraction. The Prices Index continued in expansion (or ‘increasing’) territory, registering 52.5 percent, up 2.2 percentage points compared to the reading of 50.3 percent in November. The Backlog of Orders Index registered 45.9 percent, up 4.1 percentage points compared to the 41.8 percent recorded in November. The Employment Index registered 45.3 percent, down 2.8 percentage points from November’s figure of 48.1 percent.
emphasis added
Thursday, January 02, 2025
Friday: ISM Mfg, Vehicle Sales
by Calculated Risk on 1/02/2025 07:21:00 PM
 Note: Mortgage rates are from MortgageNewsDaily.com and are for top tier scenarios.
Mortgage rates as of Monday (a little lower on Tuesday).
Friday:
• At 10:00 AM: ISM Manufacturing Index for December. The consensus is for the ISM to be at 48.3, down from 48.4 in November.
All day: Light vehicle sales for December. The Wards forecast is for 16.7 million SAAR in December, up from the BEA estimate of 16.50 million SAAR in November (Seasonally Adjusted Annual Rate).
Freddie Mac House Price Index Increased in November; Up 4.0% Year-over-year
by Calculated Risk on 1/02/2025 12:43:00 PM
Today, in the Calculated Risk Real Estate Newsletter: Freddie Mac House Price Index Increased in November; Up 4.0% Year-over-year
A brief excerpt:
Freddie Mac reported that its “National” Home Price Index (FMHPI) increased 0.56% month-over-month on a seasonally adjusted (SA) basis in November. On a year-over-year basis, the National FMHPI was up 4.0% in November, up from up 3.9% YoY in October. The YoY increase peaked at 19.1% in July 2021, and for this cycle, bottomed at up 0.9% YoY in May 2023. ...There is much more in the article!
For cities (Core-based Statistical Areas, CBSA), here are the 35 cities with the largest declines from the peak, seasonally adjusted. Austin continues to be the worst performing city. However, 15 of the 30 cities with the largest price declines are in Florida!

Construction Spending Mostly Unchanged in November
by Calculated Risk on 1/02/2025 10:00:00 AM
From the Census Bureau reported that overall construction spending increased:
Construction spending during November 2024 was estimated at a seasonally adjusted annual rate of $2,152.6 billion, virtually unchanged from the revised October estimate of $2,152.3 billion. The November figure is 3.0 percent above the November 2023 estimate of $2,090.7 billion.Private spending increased and public spending decreased:
emphasis added
Spending on private construction was at a seasonally adjusted annual rate of $1,650.7 billion, 0.1 percent above the revised October estimate of $1,649.8 billion. ...
In November, the estimated seasonally adjusted annual rate of public construction spending was $501.9 billion, 0.1 percent below the revised October estimate of $502.5 billion.
 Click on graph for larger image.
This graph shows private residential and nonresidential construction spending, and public spending, since 1993. Note: nominal dollars, not inflation adjusted.
Residential (red) spending is 7.6% below the peak in 2022.
Non-residential (blue) spending is 0.4% below the peak in June 2024.
Public construction spending is 0.2% below the peak in September 2024.
 The second graph shows the year-over-year change in construction spending.
On a year-over-year basis, private residential construction spending is up 3.1%. Non-residential spending is up 1.7% year-over-year. Public spending is up 4.6% year-over-year.
This was below consensus expectations and spending for the previous two months was revised down.
Weekly Initial Unemployment Claims Decrease to 211,000
by Calculated Risk on 1/02/2025 08:30:00 AM
The DOL reported:
In the week ending December 28, the advance figure for seasonally adjusted initial claims was 211,000, a decrease of 9,000 from the previous week's revised level. The previous week's level was revised up by 1,000 from 219,000 to 220,000. The 4-week moving average was 223,250, a decrease of 3,500 from the previous week's revised average. The previous week's average was revised up by 250 from 226,500 to 226,750.The following graph shows the 4-week moving average of weekly claims since 1971.
emphasis added
 Click on graph for larger image.
The dashed line on the graph is the current 4-week average. The four-week average of weekly unemployment claims decreased to 223,250.
The previous week was revised up.
Weekly claims were lower than the consensus forecast.
MBA: Mortgage Applications Decreased Over a Two-Week Period in Weekly Survey
by Calculated Risk on 1/02/2025 07:00:00 AM
From the MBA: Mortgage Applications Decreased Over a Two-Week Period in Latest MBA Weekly Survey
Mortgage applications decreased 21.9 percent from two weeks earlier, according to data from the Mortgage Bankers Association’s (MBA) Weekly Mortgage Applications Survey for the week ending December 27, 2024. The results include an adjustment to account for the Christmas holiday.
The Market Composite Index, a measure of mortgage loan application volume, decreased 21.9 percent on a seasonally adjusted basis from two weeks earlier. On an unadjusted basis, the Index decreased 55 percent compared with two weeks ago. The holiday adjusted Refinance Index decreased 36 percent from two weeks ago and was 10 percent higher than the same week one year ago. The unadjusted Refinance Index decreased 62 percent from two weeks ago and was 6 percent lower than the same week one year ago. The seasonally adjusted Purchase Index decreased 13 percent compared with two weeks ago. The unadjusted Purchase Index decreased 48 percent compared with two weeks ago and was 17 percent lower than the same week one year ago.
“Mortgage rates moved higher through the last full week of 2024, reaching almost 7 percent for 30-year fixed-rate loans,” said Mike Fratantoni, MBA’s SVP and Chief Economist. “Not surprisingly, this increase in rates – at a time when housing activity typically grinds to a halt – resulted in declines in both refinance and purchase applications.”
...
The average contract interest rate for 30-year fixed-rate mortgages with conforming loan balances ($766,550 or less) increased to 6.97 percent from 6.89 percent, with points increasing to 0.72 from 0.67 (including the origination fee) for 80 percent loan-to-value ratio (LTV) loans. The effective rate increased from last week.
emphasis added
 Click on graph for larger image.
The first graph shows the MBA mortgage purchase index.
According to the MBA, purchase activity is down 17% year-over-year unadjusted.
Red is a four-week average (blue is weekly).
Purchase application activity is up about 9% from the lows in late October 2023 and is now 9% below the lowest levels during the housing bust.
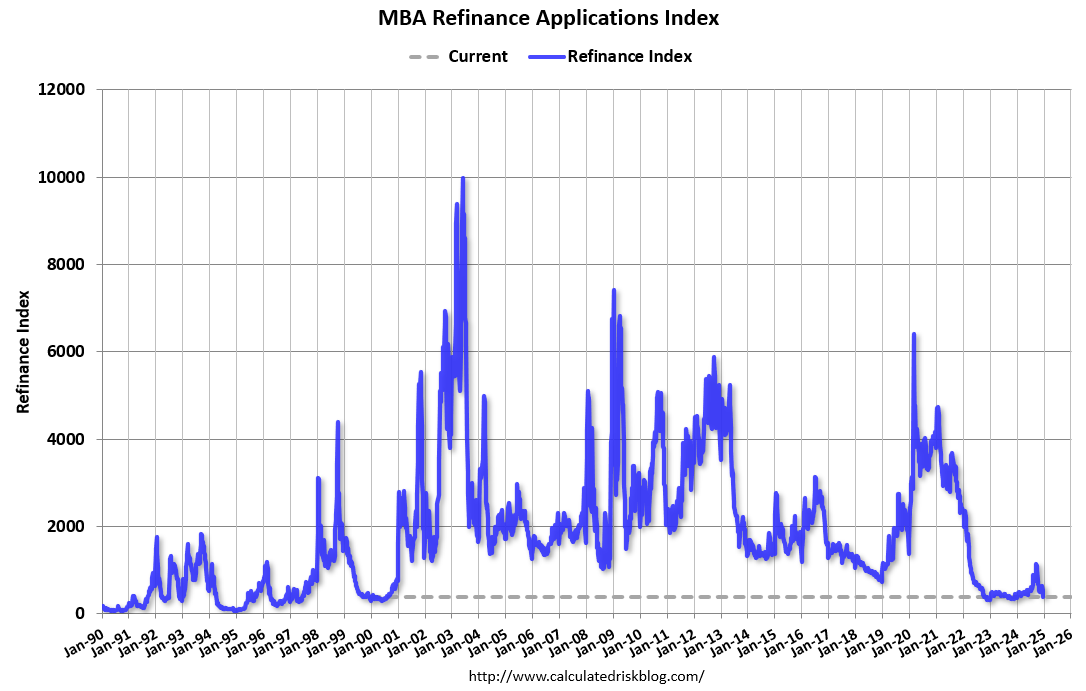
The second graph shows the refinance index since 1990.
The refinance index is very low.
Wednesday, January 01, 2025
Thursday: Unemployment Claims, Construction Spending
by Calculated Risk on 1/01/2025 08:18:00 PM
 Note: Mortgage rates are from MortgageNewsDaily.com and are for top tier scenarios.
Mortgage rates as of Monday (a little lower on Tuesday).
Thursday:
• At 7:00 AM ET, The Mortgage Bankers Association (MBA) will release two weeks of results for the mortgage purchase applications index.
• At 8:30 AM, The initial weekly unemployment claims report will be released. The consensus is for an increase to 223 thousand from 219 thousand last week.
• At 10:00 AM, Construction Spending for November. The consensus is for a 0.3% increase in construction spending.
Question #3 for 2025: What will the unemployment rate be in December 2025?
by Calculated Risk on 1/01/2025 12:40:00 PM
Earlier I posted some questions on my blog for next year: Ten Economic Questions for 2025. Some of these questions concern real estate (inventory, house prices, housing starts, new home sales), and I posted thoughts on those in the newsletter (others like GDP and employment will be on this blog).
I'm adding some thoughts and predictions for each question.
Here is a review of the Ten Economic Questions for 2024.
3) Unemployment Rate: The unemployment rate was at 4.2% in November, up from 3.7% in November 2023. Currently the FOMC is projecting the unemployment rate will increase to the 4.2% to 4.5% range in Q4 2025. What will the unemployment rate be in December 2025?
Seven years ago - back when most analysts said the unemployment rate couldn't go much lower - I noted that current demographics shared some similarities to the '60s, and that the unemployment rate bottomed at 3.4% in the '60s - and that we might see the unemployment rate that low or lower in this cycle. That happened.
Note the period in the late '60s when the unemployment rate was mostly below 4% for four consecutive years. That period ended in late 1969 with a recession.
 Click on graph for larger image.
The unemployment rate is from the household survey (CPS), and the rate increased in November to 4.2%, up from 3.7% in November 2023.
Forecasting the unemployment rate includes forecasts for economic and payroll growth, and also for changes in the participation rate (previous question).
It appears that the participation rate will decline in 2025 based on demographics and that population growth will slow due to less net migration. That suggests that the labor force will grow slowly in 2025 and might even contract! So even if job growth slows sharply in 2025 (next question), the unemployment rate will fall.
My guess is the unemployment rate will decline to 4% or so by December 2025. (Lower than the FOMC forecast of 4.2% to 4.5%).
Here are the Ten Economic Questions for 2025 and a few predictions:
• Question #1 for 2025: How much will the economy grow in 2025? Will there be a recession in 2025?
• Question #2 for 2025: How much will job growth slow in 2025? Or will the economy lose jobs?
• Question #3 for 2025: What will the unemployment rate be in December 2025?
• Question #4 for 2025: What will the participation rate be in December 2025?
• Question #5 for 2025: What will the YoY core inflation rate be in December 2025?
• Question #6 for 2025: What will the Fed Funds rate be in December 2025?
• Question #7 for 2025: How much will wages increase in 2025?
• Question #8 for 2025: How much will Residential investment change in 2025? How about housing starts and new home sales in 2025?
• Question #9 for 2025: What will happen with house prices in 2025?
• Question #10 for 2025: Will inventory increase further in 2025?
My guess is the unemployment rate will decline to 4% or so by December 2025. (Lower than the FOMC forecast of 4.2% to 4.5%).
• Question #1 for 2025: How much will the economy grow in 2025? Will there be a recession in 2025?
• Question #2 for 2025: How much will job growth slow in 2025? Or will the economy lose jobs?
• Question #3 for 2025: What will the unemployment rate be in December 2025?
• Question #4 for 2025: What will the participation rate be in December 2025?
• Question #5 for 2025: What will the YoY core inflation rate be in December 2025?
• Question #6 for 2025: What will the Fed Funds rate be in December 2025?
• Question #7 for 2025: How much will wages increase in 2025?
• Question #8 for 2025: How much will Residential investment change in 2025? How about housing starts and new home sales in 2025?
• Question #9 for 2025: What will happen with house prices in 2025?
• Question #10 for 2025: Will inventory increase further in 2025?

In Memoriam: Doris "Tanta" Dungey


| Privacy Policy |
| Copyright © 2007 - 2025 CR4RE LLC |
| Excerpts NOT allowed on x.com |