 RSS Feed
 by Calculated Risk on 4/01/2025 10:11:00 AM
Tuesday, April 01, 2025
ISM® Manufacturing index Decreased to 49.0% in March
(Posted with permission). The ISM manufacturing index indicated expansion. The PMI® was at 49.0% in March, down from 50.3% in February. The employment index was at 44.7%, down from 47.6% the previous month, and the new orders index was at 45.2%, down from 48.6%.
From ISM: Manufacturing PMI® at 49% March 2025 Manufacturing ISM® Report On Business®
Economic activity in the manufacturing sector contracted in March after two consecutive months of expansion preceded by 26 straight months of contraction, say the nation's supply executives in the latest Manufacturing ISM® Report On Business®.This suggests manufacturing contracted in March. This was below the consensus forecast, new orders and employment were especially weak and prices very strong.
The report was issued today by Timothy R. Fiore, CPSM, C.P.M., Chair of the Institute for Supply Management® (ISM®) Manufacturing Business Survey Committee:
“The Manufacturing PMI® registered 49 percent in March, 1.3 percentage points lower compared to the 50.3 percent recorded in February. The overall economy continued in expansion for the 59th month after one month of contraction in April 2020. (A Manufacturing PMI® above 42.3 percent, over a period of time, generally indicates an expansion of the overall economy.) The New Orders Index contracted for the second month in a row following a three-month period of expansion; the figure of 45.2 percent is 3.4 percentage points lower than the 48.6 percent recorded in February. The March reading of the Production Index (48.3 percent) is 2.4 percentage points lower than February’s figure of 50.7 percent. The index dropped back into contraction after two months of expansion, with eight months of contraction before that. The Prices Index surged further into expansion (or ‘increasing’) territory, registering 69.4 percent, up 7 percentage points compared to the reading of 62.4 percent in February. The Backlog of Orders Index registered 44.5 percent, down 2.3 percentage points compared to the 46.8 percent recorded in February. The Employment Index registered 44.7 percent, down 2.9 percentage points from February’s figure of 47.6 percent.
emphasis added
BLS: Job Openings Decreased to 7.6 million in February
by Calculated Risk on 4/01/2025 10:00:00 AM
From the BLS: Job Openings and Labor Turnover Summary
The number of job openings was little changed at 7.6 million in February, the U.S. Bureau of Labor Statistics reported today. Over the month, hires and total separations held at 5.4 million and 5.3 million, respectively. Within separations, quits (3.2 million) and layoffs and discharges (1.8 million) changed little.The following graph shows job openings (black line), hires (dark blue), Layoff, Discharges and other (red column), and Quits (light blue column) from the JOLTS.
emphasis added
This series started in December 2000.
Note: The difference between JOLTS hires and separations is similar to the CES (payroll survey) net jobs headline numbers. This report is for February; the employment report this Friday will be for March.
 Click on graph for larger image.
Note that hires (dark blue) and total separations (red and light blue columns stacked) are usually pretty close each month. This is a measure of labor market turnover. When the blue line is above the two stacked columns, the economy is adding net jobs - when it is below the columns, the economy is losing jobs.
The spike in layoffs and discharges in March 2020 is labeled, but off the chart to better show the usual data.
Jobs openings decreased in February to 7.57 million from 7.76 million in January.
The number of job openings (black) were down 10% year-over-year.
Quits were down 8% year-over-year. These are voluntary separations. (See light blue columns at bottom of graph for trend for "quits").
Monday, March 31, 2025
Tuesday: Job Openings, ISM Mfg, Construction Spending, Vehicle Sales
by Calculated Risk on 3/31/2025 07:17:00 PM
 From Matthew Graham at Mortgage News Daily: Mortgage Rates Inch Lower, But Remain Broadly Sideways
Sideways" has been the dominant theme for mortgage rates for well over a month now. The average top tier 30yr fixed rate fell below 6.82% on February 25th, and moved down to 6.70% the following week. We haven't been outside of that range since then.Tuesday:
Today was just another day in that regard, or perhaps even a prime example considering it was smack dab in the middle of that range. [30 year fixed 6.74%]
emphasis added
• At 10:00 AM ET, Job Openings and Labor Turnover Survey for February from the BLS.
• Also at 10:00 AM, ISM Manufacturing Index for March. The consensus is for the ISM to be at 50.3, unchanged from 50.3 in February.
• Also at 10:00 AM, Construction Spending for February. The consensus is for 0.2% increase in construction spending.
• All Day: Light vehicle sales for March.
FHFA’s National Mortgage Database: Outstanding Mortgage Rates, LTV and Credit Scores
by Calculated Risk on 3/31/2025 02:36:00 PM
Today, in the Calculated Risk Real Estate Newsletter: FHFA’s National Mortgage Database: Outstanding Mortgage Rates, LTV and Credit Scores
A brief excerpt:
Here are some graphs on outstanding mortgages by interest rate, the average mortgage interest rate, borrowers’ credit scores and current loan-to-value (LTV) from the FHFA’s National Mortgage Database through Q4 2024 (just released).There is much more in the article.
...
Here is some data showing the distribution of interest rates on closed-end, fixed-rate 1-4 family mortgages outstanding at the end of each quarter since Q1 2013 through Q4 2024.
This shows the surge in the percent of loans under 3%, and also under 4%, starting in early 2020 as mortgage rates declined sharply during the pandemic. The percent of outstanding loans under 4% peaked in Q1 2022 at 65.1% (now at 54.1%), and the percent under 5% peaked at 85.6% (now at 72.1%). These low existing mortgage rates makes it difficult for homeowners to sell their homes and buy a new home since their monthly payments would increase sharply. This was a key reason existing home inventory levels were so low.
Time is slowly eroding this lock-in effect.

Freddie Mac House Price Index Increased in February; Up 3.4% Year-over-year
by Calculated Risk on 3/31/2025 10:34:00 AM
Today, in the Calculated Risk Real Estate Newsletter: Freddie Mac House Price Index Increased in February; Up 3.4% Year-over-year
A brief excerpt:
Freddie Mac reported that its “National” Home Price Index (FMHPI) increased 0.18% month-over-month on a seasonally adjusted (SA) basis in February. On a year-over-year basis, the National FMHPI was up 3.4% in February, down from up 3.6% YoY in January. The YoY increase peaked at 19.0% in July 2021, and for this cycle, bottomed at up 0.9% YoY in May 2023. ...There is much more in the article!
For cities (Core-based Statistical Areas, CBSA), here are the 30 cities with the largest declines from the peak, seasonally adjusted. Austin continues to be the worst performing city. However, 7 of the 10 cities with the largest price declines are in Florida.

Housing March 31st Weekly Update: Inventory up 1.1% Week-over-week, Up 30.6% Year-over-year
by Calculated Risk on 3/31/2025 08:11:00 AM
Altos reports that active single-family inventory was up 1.1% week-over-week.
Inventory is now up 8.2% from the seasonal bottom in January and is increasing.
The first graph shows the seasonal pattern for active single-family inventory since 2015.
 Click on graph for larger image.
The red line is for 2025. The black line is for 2019.
Inventory was up 30.6% compared to the same week in 2024 (last week it was up 30.3%), and down 19.0% compared to the same week in 2019 (last week it was down 19.5%).
The gap to more normal inventory levels has closed significantly! It now appears inventory will be close to 2019 levels towards the end of 2025.
 This second inventory graph is courtesy of Altos Research.
As of March 28th, inventory was at 676 thousand (7-day average), compared to 668 thousand the prior week.
Mike Simonsen discusses this data regularly on Youtube
Sunday, March 30, 2025
Sunday Night Futures
by Calculated Risk on 3/30/2025 07:11:00 PM
Weekend:
• Schedule for Week of March 30, 2025
Monday:
• At 9:45 AM ET, Chicago Purchasing Managers Index for March. The consensus is for a reading of 45.5, unchanged from 45.5 in February.
• At 10:30 AM, Dallas Fed Survey of Manufacturing Activity for March. This is the last of the regional surveys for March.
From CNBC: Pre-Market Data and Bloomberg futures S&P 500 are down 31 and DOW futures are down 192 (fair value).
Oil prices were up over the last week with WTI futures at $69.36 per barrel and Brent at $73.63 per barrel. A year ago, WTI was at $85, and Brent was at $87 - so WTI oil prices are down about 18% year-over-year.
Here is a graph from Gasbuddy.com for nationwide gasoline prices. Nationally prices are at $3.12 per gallon. A year ago, prices were at $3.51 per gallon, so gasoline prices are down $0.39 year-over-year.
A few comments on the Seasonal Pattern for House Prices
by Calculated Risk on 3/30/2025 10:19:00 AM
Another update ... a few key points:
1) There is a clear seasonal pattern for house prices.
2) The surge in distressed sales during the housing bust distorted the seasonal pattern. This was because distressed sales (at lower price points) happened at a steady rate all year, while regular sales followed the normal seasonal pattern. This made for larger swings in the seasonal factor during the housing bust.
3) The seasonal swings have increased recently without a surge in distressed sales.
 Click on graph for larger image.
This graph shows the month-to-month change in the NSA Case-Shiller National index since 1987 (through January 2025). The seasonal pattern was smaller back in the '90s and early '00s and increased once the bubble burst.
The seasonal swings declined following the bust, however the pandemic price surge changed the month-over-month pattern.
 The second graph shows the seasonal factors for the Case-Shiller National index since 1987. The factors started to change near the peak of the bubble, and really increased during the bust since normal sales followed the regular seasonal pattern - and distressed sales happened all year.
The swings in the seasonal factors were decreasing following the bust but have increased again recently - this time without a surge in distressed sales.
 Click on graph for larger image.
This graph shows the month-to-month change in the NSA Case-Shiller National index since 1987 (through January 2025). The seasonal pattern was smaller back in the '90s and early '00s and increased once the bubble burst.
The seasonal swings declined following the bust, however the pandemic price surge changed the month-over-month pattern.
 The second graph shows the seasonal factors for the Case-Shiller National index since 1987. The factors started to change near the peak of the bubble, and really increased during the bust since normal sales followed the regular seasonal pattern - and distressed sales happened all year.
 The swings in the seasonal factors were decreasing following the bust but have increased again recently - this time without a surge in distressed sales.
Saturday, March 29, 2025
Real Estate Newsletter Articles this Week: New Home Sales Increase to 676,000 Annual Rate in February
by Calculated Risk on 3/29/2025 02:11:00 PM
At the Calculated Risk Real Estate Newsletter this week:
 Click on graph for larger image.
• New Home Sales Increase to 676,000 Annual Rate in February
• Case-Shiller: National House Price Index Up 4.1% year-over-year in January
• Policy and 2025 Housing Outlook
• Fannie and Freddie: Single Family Serious Delinquency Rates Unchanged in February
• Final Look at Local Housing Markets in February and a Look Ahead to March Sales
• Inflation Adjusted House Prices 0.8% Below 2022 Peak
This is usually published 4 to 6 times a week and provides more in-depth analysis of the housing market.
Schedule for Week of March 30, 2025
by Calculated Risk on 3/29/2025 08:11:00 AM
The key report scheduled for this week is the March employment report on Friday.
Other key reports include the February Trade Deficit and March Auto Sales.
For manufacturing, the March ISM Manufacturing and Dallas Fed surveys will be released.
Fed Chair Powell speaks on Friday.
----- Monday, March 31st -----
9:45 AM: Chicago Purchasing Managers Index for March. The consensus is for a reading of 45.5, unchanged from 45.5 in February.
10:30 AM: Dallas Fed Survey of Manufacturing Activity for March. This is the last of the regional surveys for March.
----- Tuesday, April 1st -----
 10:00 AM ET: Job Openings and Labor Turnover Survey for February from the BLS.
This graph shows job openings (black line), hires (dark blue), Layoff, Discharges and other (red column), and Quits (light blue column) from the JOLTS.
Jobs openings increased in January to 7.74 million from 7.51 million in December.
The number of job openings (black) were down 9% year-over-year. Quits were down 3% year-over-year.
10:00 AM: ISM Manufacturing Index for March. The consensus is for the ISM to be at 50.3, unchanged from 50.3 in February.
10:00 AM: Construction Spending for February. The consensus is for 0.2% increase in construction spending.
 All Day: Light vehicle sales for March. The consensus is for light vehicle sales to be 16.6 million SAAR in March, up from 16.0 million in February (Seasonally Adjusted Annual Rate).
This graph shows light vehicle sales since the BEA started keeping data in 1967. The dashed line is the February sales rate.
----- Wednesday, April 2nd -----
7:00 AM ET: The Mortgage Bankers Association (MBA) will release the results for the mortgage purchase applications index.
8:15 AM: The ADP Employment Report for March. This report is for private payrolls only (no government). The consensus is for 119,000 payroll jobs added in March, up from 77,000 added in February.
----- Thursday, April 3rd -----
8:30 AM: The initial weekly unemployment claims report will be released. The consensus is for 225 initial claims up from 224 thousand last week.
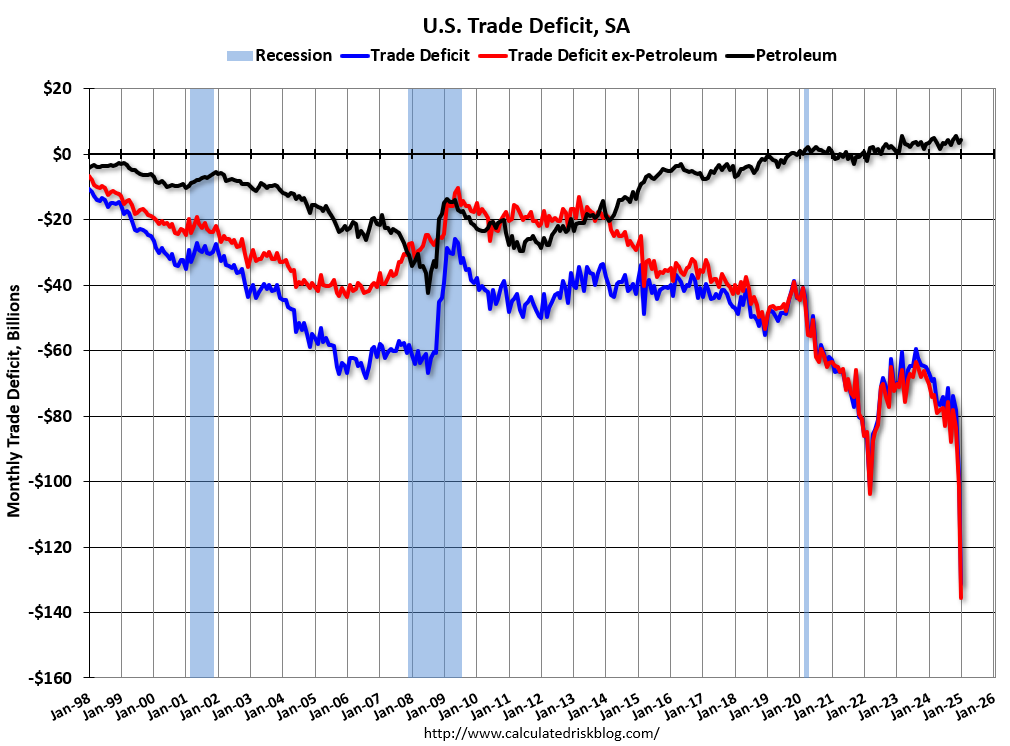
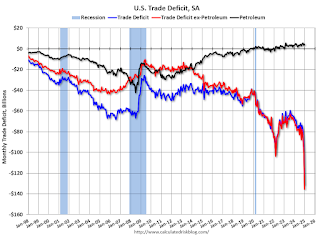 8:30 AM: Trade Balance report for February from the Census Bureau.
This graph shows the U.S. trade deficit, with and without petroleum, through the most recent report. The blue line is the total deficit, and the black line is the petroleum deficit, and the red line is the trade deficit ex-petroleum products.
The consensus is the trade deficit to be $110.0 billion. The U.S. trade deficit was at $131.4 billion in January.
10:00 AM: the ISM Services Index for March.
----- Friday, April 4th -----
 8:30 AM: Employment Report for March. The consensus is for 135,000 jobs added, and for the unemployment rate to be unchanged at 4.1%.
There were 151,000 jobs added in February, and the unemployment rate was at 4.1%.
This graph shows the jobs added per month since January 2021.
11:25 AM: Speech, Fed Chair Jerome Powell, Economic Outlook, At the Society for Advancing Business Editing and Writing (SABEW) Annual Conference, Arlington, Virginia
9:45 AM: Chicago Purchasing Managers Index for March. The consensus is for a reading of 45.5, unchanged from 45.5 in February.
10:30 AM: Dallas Fed Survey of Manufacturing Activity for March. This is the last of the regional surveys for March.
 10:00 AM ET: Job Openings and Labor Turnover Survey for February from the BLS.
 This graph shows job openings (black line), hires (dark blue), Layoff, Discharges and other (red column), and Quits (light blue column) from the JOLTS.
Jobs openings increased in January to 7.74 million from 7.51 million in December.
The number of job openings (black) were down 9% year-over-year. Quits were down 3% year-over-year.
10:00 AM: ISM Manufacturing Index for March. The consensus is for the ISM to be at 50.3, unchanged from 50.3 in February.
10:00 AM: Construction Spending for February. The consensus is for 0.2% increase in construction spending.
 All Day: Light vehicle sales for March. The consensus is for light vehicle sales to be 16.6 million SAAR in March, up from 16.0 million in February (Seasonally Adjusted Annual Rate).
This graph shows light vehicle sales since the BEA started keeping data in 1967. The dashed line is the February sales rate.
7:00 AM ET: The Mortgage Bankers Association (MBA) will release the results for the mortgage purchase applications index.
8:15 AM: The ADP Employment Report for March. This report is for private payrolls only (no government). The consensus is for 119,000 payroll jobs added in March, up from 77,000 added in February.
8:30 AM: The initial weekly unemployment claims report will be released. The consensus is for 225 initial claims up from 224 thousand last week.
 8:30 AM: Trade Balance report for February from the Census Bureau.
 This graph shows the U.S. trade deficit, with and without petroleum, through the most recent report. The blue line is the total deficit, and the black line is the petroleum deficit, and the red line is the trade deficit ex-petroleum products.
The consensus is the trade deficit to be $110.0 billion. The U.S. trade deficit was at $131.4 billion in January.
10:00 AM: the ISM Services Index for March.
 8:30 AM: Employment Report for March. The consensus is for 135,000 jobs added, and for the unemployment rate to be unchanged at 4.1%.
There were 151,000 jobs added in February, and the unemployment rate was at 4.1%.
This graph shows the jobs added per month since January 2021.
11:25 AM: Speech, Fed Chair Jerome Powell, Economic Outlook, At the Society for Advancing Business Editing and Writing (SABEW) Annual Conference, Arlington, Virginia


