 RSS Feed
 by Calculated Risk on 4/10/2025 03:47:00 PM
Thursday, April 10, 2025
Hotels: Occupancy Rate Decreased 0.6% Year-over-year
The U.S. hotel industry reported mixed year-over-year comparisons, according to CoStar’s latest data through 5 April. ...The following graph shows the seasonal pattern for the hotel occupancy rate using the four-week average.
30 March through 5 April 2025 (percentage change from comparable week in 2024):
• Occupancy: 63.8% (-0.6%)
• Average daily rate (ADR): US$160.18 (+1.4%)
• Revenue per available room (RevPAR): US$102.21 (+0.8%)
emphasis added
 Click on graph for larger image.
The red line is for 2025, blue is the median, and dashed light blue is for 2024. Dashed purple is for 2018, the record year for hotel occupancy.
The 4-week average of the occupancy rate is tracking last year and is at the median rate for the period 2000 through 2024 (Blue).
Note: Y-axis doesn't start at zero to better show the seasonal change.
The 4-week average will mostly move sideways until the summer travel season. We might see a hit to occupancy during the summer months due to less international tourism.
Part 2: Current State of the Housing Market; Overview for mid-April 2025
by Calculated Risk on 4/10/2025 12:45:00 PM
Today, in the Calculated Risk Real Estate Newsletter: Part 2: Current State of the Housing Market; Overview for mid-April 2025
A brief excerpt:
Yesterday, in Part 1: Current State of the Housing Market; Overview for mid-April 2025 I reviewed home inventory, housing starts and sales.There is much more in the article.
In Part 2, I will look at house prices, mortgage rates, rents and more.
These “Current State” summaries show us where we came from, where we are, and hopefully give us clues as to where we are going!
Note: Yesterday, I expressed concern about policy impacting housing and the economy. Then, at 12:57 PM ET, Goldman Sachs economists put out a note titled: Moving to a Recession Baseline. They argued - based on announced tariffs - that they were forecasting a recession and for the unemployment rate to rise to 5.7% in Q4.
Minutes later, a 90-day pause for most tariffs was announced (reducing tariffs to 10%, except China). An hour later Goldman Sachs put out a second note: Reverting to Our Previous Non-Recession Baseline. However, they still maintained a 45% change of recession in the next 12 months.
Forecasting is especially difficult with rapidly changing policy!
...
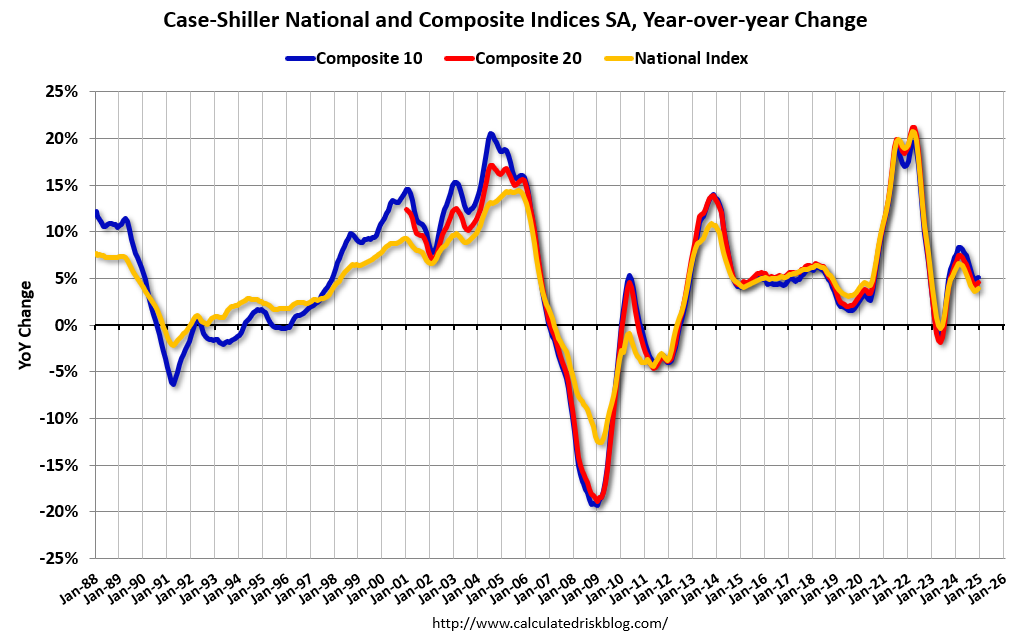
The Case-Shiller National Index increased 4.1% year-over-year (YoY) in January and will be about the same YoY - or slightly lower - in the February report (based on other data).
The MoM increase in the seasonally adjusted (SA) Case-Shiller National Index was at 0.57% (a 7.0% annual rate), This was the 24th consecutive MoM increase in the seasonally adjusted index.
Cleveland Fed: Median CPI increased 0.3% and Trimmed-mean CPI increased 0.2% in March
by Calculated Risk on 4/10/2025 11:20:00 AM
The Cleveland Fed released the median CPI and the trimmed-mean CPI.
According to the Federal Reserve Bank of Cleveland, the median Consumer Price Index rose 0.3% in February. The 16% trimmed-mean Consumer Price Index increased 0.2%. "The median CPI and 16% trimmed-mean CPI are measures of core inflation calculated by the Federal Reserve Bank of Cleveland based on data released in the Bureau of Labor Statistics’ (BLS) monthly CPI report".
 Click on graph for larger image.
This graph shows the year-over-year change for these four key measures of inflation.
On a year-over-year basis, the median CPI rose 3.5% (down slightly unrounded from 3.5% YoY in February), the trimmed-mean CPI rose 3.0% (down from 3.1%), and the CPI less food and energy rose 2.8% (down from 3.1%).
Core PCE is for February was up 2.8% YoY, up from 2.7% in January. Based on the CPI report this morning, Core PCE is expected to decline to 2.6% YoY in March.
YoY Measures of Inflation: Services, Goods and Shelter
by Calculated Risk on 4/10/2025 08:54:00 AM
Here are a few measures of inflation:
The first graph is the one Fed Chair Powell had mentioned two years ago when services less rent of shelter was up around 8% year-over-year. This declined and is now up 3.3% YoY.
 Click on graph for larger image.
This graph shows the YoY price change for Services and Services less rent of shelter through March 2025.
Services were up 3.7% YoY as of March 2025, down from 4.1% YoY in February.
Services less rent of shelter was up 3.3% YoY in March, down from 3.8% YoY in February.
Services less rent of shelter was up 3.3% YoY in March, down from 3.8% YoY in February.
 The second graph shows that goods prices started to increase year-over-year (YoY) in 2020 and accelerated in 2021 due to both strong demand and supply chain disruptions.
Durables were at -1.0% YoY as of March 2025, up from -1.2% YoY in February.
Commodities less food and energy commodities were at 0.0% YoY in March, unchanged from 0.0% YoY in February.
Commodities less food and energy commodities were at 0.0% YoY in March, unchanged from 0.0% YoY in February.
 Here is a graph of the year-over-year change in shelter from the CPI report (through March) and housing from the PCE report (through February)
Shelter was up 4.0% year-over-year in March, down from 4.2% in February. Housing (PCE) was up 4.3% YoY in February, down from 4.5% in January.
This is still catching up with private new lease data.
Core CPI ex-shelter was up 1.8% YoY in March.
BLS: CPI Decreased 0.1% in March; Core CPI increased 0.1%
by Calculated Risk on 4/10/2025 08:36:00 AM
The Consumer Price Index for All Urban Consumers (CPI-U) decreased 0.1 percent on a seasonally adjusted basis in March, after rising 0.2 percent in February, the U.S. Bureau of Labor Statistics reported today. Over the last 12 months, the all items index increased 2.4 percent before seasonal adjustment.The change in CPI was below expectations. I'll post a graph later today after the Cleveland Fed releases the median and trimmed-mean CPI.
The index for energy fell 2.4 percent in March, as a 6.3-percent decline in the index for gasoline more than offset increases in the indexes for electricity and natural gas. The food index, in contrast, rose 0.4 percent in March as the food at home index increased 0.5 percent and the food away from home index rose 0.4 percent over the month.
The index for all items less food and energy rose 0.1 percent in March, following a 0.2-percent increase in February. Indexes that increased over the month include personal care, medical care, education, apparel, and new vehicles. The indexes for airline fares, motor vehicle insurance, used cars and trucks, and recreation were among the major indexes that decreased in March.
The all items index rose 2.4 percent for the 12 months ending March, after rising 2.8 percent over the 12 months ending February. The all items less food and energy index rose 2.8 percent over the last 12 months, the smallest 12-month increase since March 2021. The energy index decreased 3.3 percent for the 12 months ending March. The food index increased 3.0 percent over the last year.
emphasis added
Weekly Initial Unemployment Claims Increase to 223,000
by Calculated Risk on 4/10/2025 08:30:00 AM
The DOL reported:
In the week ending April 5, the advance figure for seasonally adjusted initial claims was 223,000, an increase of 4,000 from the previous week's unrevised level of 219,000. The 4-week moving average was 223,000, unchanged from the previous week's unrevised average of 223,000.The following graph shows the 4-week moving average of weekly claims since 1971.
emphasis added
 Click on graph for larger image.
The dashed line on the graph is the current 4-week average. The four-week average of weekly unemployment claims was unchanged at 223,000.
The previous week was unchanged.
Weekly claims were close to the consensus forecast.
Wednesday, April 09, 2025
Thursday: Unemployment Claims, CPI
by Calculated Risk on 4/09/2025 08:14:00 PM
 Note: Mortgage rates are from MortgageNewsDaily.com and are for top tier scenarios.
Thursday:
• At 8:30 AM ET, The initial weekly unemployment claims report will be released. The consensus is for 225 initial claims up from 219 thousand last week.
• Also at 8:30 AM, The Consumer Price Index for March from the BLS. The consensus is for 0.1% increase in CPI (up 2.6% YoY) and a 0.3% increase in core CPI (up 3.0% YoY).
Philly Fed: State Coincident Indexes Increased in 45 States in February (3-Month Basis)
by Calculated Risk on 4/09/2025 05:01:00 PM
From the Philly Fed:
The Federal Reserve Bank of Philadelphia has released the coincident indexes for the 50 states for February 2025. Over the past three months, the indexes increased in 45 states, decreased in three states, and remained stable in two, for a three-month diffusion index of 84. Additionally, in the past month, the indexes increased in 38 states, decreased in six states, and remained stable in six, for a one-month diffusion index of 64. For comparison purposes, the Philadelphia Fed has also developed a similar coincident index for the entire United States. The Philadelphia Fed’s U.S. index increased 0.8 percent over the past three months and 0.1 percent in February.Note: These are coincident indexes constructed from state employment data. An explanation from the Philly Fed:
emphasis added
The coincident indexes combine four state-level indicators to summarize current economic conditions in a single statistic. The four state-level variables in each coincident index are nonfarm payroll employment, average hours worked in manufacturing by production workers, the unemployment rate, and wage and salary disbursements deflated by the consumer price index (U.S. city average). The trend for each state’s index is set to the trend of its gross domestic product (GDP), so long-term growth in the state’s index matches long-term growth in its GDP.
 Click on map for larger image.
Here is a map of the three-month change in the Philly Fed state coincident indicators. This map was all red during the worst of the Pandemic and also at the worst of the Great Recession.
The map is mostly positive on a three-month basis.
Source: Philly Fed.
 And here is a graph is of the number of states with one month increasing activity according to the Philly Fed.
 This graph includes states with minor increases (the Philly Fed lists as unchanged).
In February, 41 states had increasing activity including minor increases.
In February, 41 states had increasing activity including minor increases.
FOMC Minutes: "Inflation was likely to be boosted this year"
by Calculated Risk on 4/09/2025 02:06:00 PM
From the Fed: Minutes of the Federal Open Market Committee, March 18–19, 2025. Excerpt:
With regard to the outlook for inflation, participants judged that inflation was likely to be boosted this year by the effects of higher tariffs, although significant uncertainty surrounded the magnitude and persistence of such effects. Several participants noted that the announced or planned tariff increases were larger and broader than many of their business contacts had expected. Several participants also noted that their contacts were already reporting increases in costs, possibly in anticipation of rising tariffs, or that their contacts had indicated willingness to pass on to consumers higher input costs that would arise from potential tariff increases. A couple of participants highlighted factors that might limit the inflationary effects of tariffs, noting that many households had depleted the excess savings they had accumulated during the pandemic and were less likely to accept additional price increases, or that stricter immigration policies might reduce demand for rental and affordable housing and alleviate upward pressures on housing inflation. A couple of participants noted that the continued balance in the labor market suggested that labor market conditions were unlikely to be a source of inflationary pressure. A couple of participants noted that, in the period ahead, it could be especially difficult to distinguish between relatively persistent changes in inflation and more temporary changes that might be associated with the introduction of tariffs. Participants commented on a range of factors that could influence the persistence of tariff effects, including the extent to which tariffs are imposed on intermediate goods and thus affect input costs at various stages of production, the extent to which complex supply chains need to be restructured, the actions of trading partners in responding with retaliatory increases in tariffs, and the stability of longer-term inflation expectations.
emphasis added
Trump Drops Tariffs to 10%
by Calculated Risk on 4/09/2025 02:00:00 PM
Just minutes after Goldman Sachs put out a note forecasting a recession, Mr. Trump lowered all tariffs to 10% (except China).
First, from Goldman Sachs economists:
Moving to a Recession Baseline We now expect the US’s effective tariff rate to rise by at least 20pp and are forecasting a recession with a 12-month probability of 65%. We think the White House is unlikely to quickly reverse most of the new tariffs, but our probability of recession would decline if it does.And just minutes later from CNBC: Trump temporarily drops tariffs to 10% for most countries, hits China harder with 125%
We now forecast GDP growth of -1% this year on a Q4/Q4 basis (or +0.7% on an annual average basis) and a 1.5pp increase in the unemployment rate to 5.7%. This would be less severe than most past US recessions, in part because we do not see major financial imbalances that need to unwind, private sector balance sheets remain strong, and we see some room for trade deals to eventually lower tariff rates somewhat.
emphasis added
President Donald Trump on Wednesday dropped tariffs under his new trade plan to 10% on imports from most countries, as he announced a 90-day pause for stiffer, so-called reciprocal tariffs that took effect this week.It is impossible to forecast with rapidly changing policy.
Trump also said in a social media post that he was raising the tariffs imposed on imports from China to 125% “effective immediately” due to the “lack of respect that China has shown to the World’s Markets.”


