by Calculated Risk on 3/01/2009 02:08:00 AM
Sunday, March 01, 2009
Report: AIG Deal Near
From Reuters: Exclusive: AIG near deal on new terms of bailout (ht Brad)
American International Group Inc is close to a deal with the U.S. government ... The revised AIG agreement is expected to include an additional equity commitment of about $30 billion, more lenient terms on an existing preferred investment, and a lower interest rate on a $60 billion government credit line ...It sounds like the deal will be announced on Monday.
AIG will also give the U.S. Federal Reserve ownership interests in American Life Insurance (Alico), ... [and] American International Assurance Co (AIA) in return for reducing its debt ... The board ... is due to meet on Sunday to vote on the deal ...
Saturday, February 28, 2009
Late Night Comments
by Calculated Risk on 2/28/2009 11:59:00 PM
Just a few comments on comments ...
I'm working with JS-Kit. They have moved all the old comments over to the new database.
Hopefully we can have the default be "flat". And we can add a refresh (that takes the user to the bottom).
JS-Kit will also be adding the following features:
Best to all. And thanks for your patience.
HSBC to take £17bn Bad Loan Provision
by Calculated Risk on 2/28/2009 05:08:00 PM
From The Times: HSBC takes £17bn hit on bad loans
HSBC is to own up to the full horror of its American sub-prime business, Household, when it unveils a £7 billion goodwill write-off in addition to a £17 billion provision against rising bad loans.Oh, the horror! The confessional remains busy, and AIG will be dropping by on Monday.
The provisions will be announced tomorrow alongside a heavily discounted £12 billion rights issue – the biggest ever held in Britain – and a dividend cut ...
The fundraising will make HSBC the strongest bank in the world that has not received a cash injection from the state. Its tier-one ratio, a key measure of financial strength, will rise from 8.5% to 10.5%. Analysts say it will provide a $40 billion (£28 billion) buffer against further bad debts.
February Economic Summary in Graphs
by Calculated Risk on 2/28/2009 09:59:00 AM
Here is a collection of 20 real estate and economic graphs from February ...
 New Home Sales in January
The first graph shows monthly new home sales (NSA - Not Seasonally Adjusted).
Note the Red column for January 2009. This is the lowest sales for January since the Census Bureau started tracking sales in 1963. (NSA, 23 thousand new homes were sold in January 2009).
From: Record Low New Home Sales in January
 Housing Starts in January
Total housing starts were at 464 thousand (SAAR) in January, by far the lowest level since the Census Bureau began tracking housing starts in 1959.
Single-family starts were at 347 thousand in January; also the lowest level ever recorded (since 1959).
From: Housing Starts at Another Record Low
 Construction Spending in December
This graph shows private residential and nonresidential construction spending since 1993.
Residential construction spending is still declining, and now nonresidential spending has peaked and will probably decline sharply over the next 18 months.
From: Construction Spending: Private Nonresidential has Peaked
 January Employment Report
This graph shows the unemployment rate and the year over year change in employment vs. recessions.
Nonfarm payrolls decreased by 598,00 in January, and the annual revision reduced employment by another 311,000 in 2008. The economy has lost almost 2.5 million jobs over the last 5 months!
The unemployment rate rose to 7.6 percent; the highest level since June 1992.
Year over year employment is now strongly negative (there were 3.5 million fewer Americans employed in Jan 2008 than in Jan 2007).
From: January Employment Report: 598,000 Jobs Lost, Unemployment Rate 7.6%
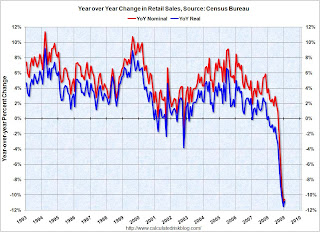 January Retail Sales
This graph shows the year-over-year change in nominal and real retail sales since 1993.
Although the Census Bureau reported that nominal retail sales decreased 10.6% year-over-year (retail and food services decreased 9.7%), real retail sales declined by 10.9% (on a YoY basis). The YoY change decreased slightly from last month.
From: Retail Sales Increase Slightly in January
 LA Port Traffic in January
This graph shows the combined loaded inbound and outbound traffic at the ports of Long Beach and Los Angeles in TEUs (TEUs: 20-foot equivalent units or 20-foot-long cargo container).
Inbound traffic was 14% below last January. This slowdown in imports (inbound traffic to the U.S.) is hitting Asian countries hard. There was a slight increase from December to January, but that appears to be mostly seasonal (the data is NSA).
For the LA area ports, outbound traffic continued to decline in January, and was 28% below the level of January 2008. Export traffic is now at about the same level as in 2005.
From: LA Area Ports: Exports Decline in January
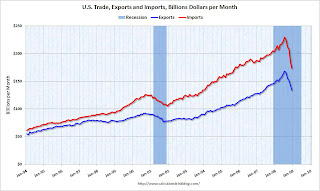 U.S. Imports and Exports Through December
The first graph shows the monthly U.S. exports and imports in dollars through December 2008. The recent rapid decline in foreign trade continued in December. Note that a large portion of the decline in imports is related to the fall in oil prices - but not all.
From: U.S. Trade: Exports and Imports Decline Sharply
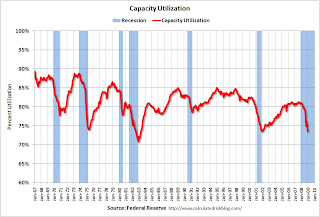 January Capacity Utilization
The Federal Reserve reported that industrial production fell 1.8 percent in January, and output in January was 10.0% below January 2008. The capacity utilization rate for total industry fell to 72.0%, the lowest level since 1983.
The significant decline in capacity utilization suggests less investment in non-residential structures for some time.
From: Capacity Utilization and Industrial Production Cliff Diving
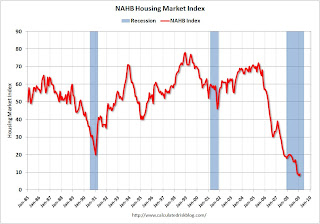 NAHB Builder Confidence Index in February
This graph shows the builder confidence index from the National Association of Home Builders (NAHB).
The housing market index (HMI) increased slightly to 9 in February from the record low of 8 set in January.
From: NAHB Housing Market Index Near Record Low
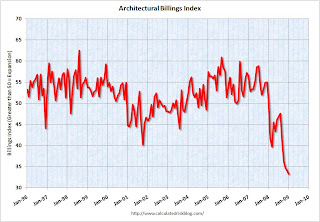 Architecture Billings Index for January
The American Institute of Architects (AIA) reported the January ABI rating was 33.3, down from the 34.1 mark in December (any score above 50 indicates an increase in billings).
From: Architecture Billings Index Hits Another Record Low
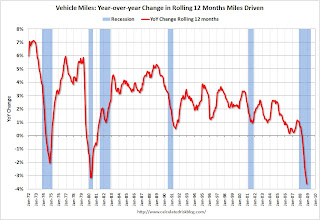 Vehicle Miles driven in December
This graph shows the annual change in the rolling 12 month average of U.S. vehicles miles driven. Note: the rolling 12 month average is used to remove noise and seasonality.
By this measure, vehicle miles driven are off 3.6% Year-over-year (YoY); the decline in miles driven is worse than during the early '70s and 1979-1980 oil crisis. As the DOT noted, miles driven in December 2008 were 1.6% less than December 2007, so the YoY change in the rolling average may start to increase.
From: U.S. Vehicle Miles Driven Off 3.6% in 2008
 Existing Home Sales in January
 This graph shows existing home sales, on a Seasonally Adjusted Annual Rate (SAAR) basis since 1993.
Sales in January 2009 (4.49 million SAAR) were 5.4% lower than last month, and were 8.6% lower than January 2008 (4.91 million SAAR).
From: More on Existing Home Sales (and Graphs)
 Existing Home Inventory
This graph shows inventory by month starting in 2004. Inventory levels were flat for years (during the bubble), but started increasing at the end of 2005.
Inventory levels increased sharply in 2006 and 2007, but have been close to 2007 levels for most of 2008. In fact inventory for the last five months was below the levels of last year. This might indicate that inventory levels are close to the peak for this cycle.
From: More on Existing Home Sales (and Graphs)
 Case Shiller House Prices for December
This graph shows the nominal Composite 10 and Composite 20 indices (the Composite 20 was started in January 2000).
The Composite 10 index is off 28.3% from the peak.
The Composite 20 index is off 27.0% from the peak.
From: Case-Shiller: House Prices Decline Sharply in December
 Price-to-Rent Ratio for Q4
This graph shows the price to rent ratio (Q1 1997 = 1.0) for the Case-Shiller national Home Price Index. For rents, the national Owners' Equivalent Rent from the BLS is used.
Looking at the price-to-rent ratio based on the Case-Shiller index, the adjustment in the price-to-rent ratio is probably 75% to 85% complete as of Q4 2008 on a national basis. This ratio will probably continue to decline.
However it now appears rents are falling too (although this is not showing up in the OER measure yet) and this will impact the price-to-rent ratio.
From: House Prices: Real Prices, Price-to-Rent, and Price-to-Income
 Unemployment Claims
This graph shows weekly claims and continued claims since 1971.
The four week moving average is at 639,000 the highest since 1982.
Continued claims are now at 5.11 million - another new record (not adjusted for population) - above the previous all time peak of 4.71 million in 1982.
From: Weekly Claims: Continued Claims Over 5 Million
 Restaurant Performance Index for January
"The Association’s Restaurant Performance Index (RPI) – a monthly composite index that tracks the health of and outlook for the U.S. restaurant industry – stood at 97.4 in January, up 1.0 percent from December’s record low level of 96.4."
From: Restaurant Performance Index Rebounds Slightly
 New Home Sales
This graph shows New Home Sales vs. recessions for the last 45 years. New Home sales have fallen off a cliff.
From: Record Low New Home Sales in January
 Q4 Homeownership Rate
The homeownership rate decreased slightly to 67.5% and is now back to the levels of late 2000.
Note: graph starts at 60% to better show the change.
From: Q4: Homeownership Rate Declines to 2000 Level
 New Home Months of Supply
The months of supply is at an all time record 13.3 months in January.
From: Record Low New Home Sales in January
Buffett's Letter to Shareholders
by Calculated Risk on 2/28/2009 08:27:00 AM
Here is Buffett's Letter to Shareholders
There are several interesting sections, but for housing I think the section on Clayton Homes (Buffett's manufactured home division) is especially interesting. Here is a brief excerpt (starts on page 10). First Buffett describes the lending debacle in the manufactured home industry in the 1997 to 2000 period:
Clayton is the largest company in the manufactured home industry, delivering 27,499 units last year. This came to about 34% of the industry’s 81,889 total. Our share will likely grow in 2009, partly because much of the rest of the industry is in acute distress.And now Buffett draws a parallel to the national housing bubble:
...
[In 1998] much of the industry employed sales practices that were atrocious. Writing about the period somewhat later, I described it as involving “borrowers who shouldn’t have borrowed being financed by lenders who shouldn’t have lent.”
To begin with, the need for meaningful down payments was frequently ignored. Sometimes fakery was involved. ... Moreover, impossible-to-meet monthly payments were being agreed to by borrowers who signed up because they had nothing to lose. The resulting mortgages were usually packaged (“securitized”) and sold by Wall Street firms to unsuspecting investors. This chain of folly had to end badly, and it did.
... industry losses were staggering. And the hangover continues to this day. This 1997-2000 fiasco should have served as a canary-in-the-coal-mine warning for the far-larger conventional housing market. But investors, government and rating agencies learned exactly nothing from the manufactured-home debacle.
[I]n an eerie rerun of that disaster, the same mistakes were repeated with conventional homes in the 2004-07 period: Lenders happily made loans that borrowers couldn’t repay out of their incomes, and borrowers just as happily signed up to meet those payments. Both parties counted on “house-price appreciation” to make this otherwise impossible arrangement work. ... The consequences of this behavior are now reverberating through every corner of our economy.
Clayton’s 198,888 borrowers, however, have continued to pay normally throughout the housing crash ... This is not because these borrowers are unusually creditworthy ... Why are our borrowers – characteristically people with modest incomes and far-from-great credit scores – performing so well? The answer is elementary, going right back to Lending 101. Our borrowers simply looked at how full-bore mortgage payments would compare with their actual – not hoped-for – income and then decided whether they could live with that commitment. Simply put, they took out a mortgage with the intention of paying it off, whatever the course of home prices.
Just as important is what our borrowers did not do. They did not count on making their loan payments by means of refinancing. They did not sign up for “teaser” rates that upon reset were outsized relative to their income. And they did not assume that they could always sell their home at a profit if their mortgage payments became onerous. Jimmy Stewart would have loved these folks.
...
Homeowners who have made a meaningful down-payment – derived from savings and not from other borrowing – seldom walk away from a primary residence simply because its value today is less than the mortgage. Instead, they walk when they can’t make the monthly payments.
...
The present housing debacle should teach home buyers, lenders, brokers and government some simple lessons that will ensure stability in the future. Home purchases should involve an honest-to-God down payment of at least 10% and monthly payments that can be comfortably handled by the borrower’s income. That income
should be carefully verified.
Putting people into homes, though a desirable goal, shouldn’t be our country’s primary objective. Keeping them in their homes should be the ambition.
UK: 500,000 Lloyds Borrowers have Negative Equity
by Calculated Risk on 2/28/2009 01:07:00 AM
From The Times: Lloyds counts cost of HBOS takeover and property slump as 500,000 customers slip into negative equity
HBOS, Britain’s biggest mortgage lender, revealed that 381,669 customers, about 16.8 per cent of its mortgage book, owed more than the value of their homes. At Lloyds TSB, 162,000 homeowners, 15 per cent of its mortgage book, were in the same position.Also on comments: Haloscan crashed hard, so I switched to JS-Kit. I'll try to improve the JS-Kit interface, and hopefully Ken (CR Companion) will be able to provide some help. Thanks to everyone for your patience.
These figures compare with only 0.1 per cent of customers of each bank – a total of less than 4,000 households – being in negative equity at the end of 2007.
...
Michael Saunders, chief economist at Citigroup, said last month that the bank estimated homeowners with negative equity was up to about 1.2 million, from 100,000 a year ago, out of a total of between 11 million and 12 million mortgages. “There is no sign that the decline in house prices – and hence the surge in negative equity – is yet close to ending,” he said.
He said in December that about one owner in four could be in negative equity if prices fell by a total of 30 per cent by 2010, as many analysts expect.
Friday, February 27, 2009
High on the Hill
by Calculated Risk on 2/27/2009 09:31:00 PM
Tomorrow morning at 8AM ET, the Buffett letter to investors will be released, and later I'll post a February Economic Summary in Graphs.
The AIG deal might be announced Sunday evening or Monday morning.
Today real GDP growth was revised down to minus 6.2% (annualized), the Citi deal was announced, two banks failed (Heritage Community Bank, Glenwood, Illinois and Security Savings Bank, Henderson, Nevada), and the S&P 500 is back to 1996 prices.
Also, the Restaurant Performance Index for January was released, and here is a look at Investment Contributions to GDP.
If you need a laugh after reading that news, Jim the Realtor showcases an investment opportunity in San Diego - enjoy!
Bank Failure #16 in 2009: Security Savings Bank, Henderson, Nevada
by Calculated Risk on 2/27/2009 07:45:00 PM
From the FDIC: Bank of Nevada, Las Vegas, Nevada Assumes All of the Deposits of Security Savings Bank, Henderson, Nevada
Security Savings Bank, Henderson, Nevada was closed today by the Nevada Financial Institutions Division, which appointed the Federal Deposit Insurance Corporation (FDIC) as receiver. ...That makes two today! Update ... by Soylent Green Is People
As of December 31, 2008, Security Savings Bank had total assets of approximately $238.3 million and total deposits of $175.2 million. Bank of Nevada did not pay a premium to acquire the deposits of Security Savings Bank.
...
The FDIC estimates that the cost to the Deposit Insurance Fund will be $59.1 million. The Bank of Nevada's acquisition of all the deposits of Security Saving Bank was the "least costly" resolution for the FDIC's Deposit Insurance Fund compared to alternatives. Security Savings Bank is the sixteenth bank to fail in the nation this year.
Security is toast as well
Yes, Friday is here.
Bank Failure #15 in 2009: Heritage Community Bank, Glenwood, Illinois
by Calculated Risk on 2/27/2009 07:27:00 PM
From the FDIC: MB Financial Bank, N.A., Chicago, Illinois, Assumes All of the Deposits of Heritage Community Bank, Glenwood, Illinois
Heritage Community Bank, Glenwood, Illinois, was closed today by the Illinois Department of Financial Professional Regulation, Division of Banking, which appointed the Federal Deposit Insurance Corporation (FDIC) as receiver. ...It is Friday ... oh wait, there is another one too!
As of December 5, 2008, Heritage Community Bank had total assets of $232.9 million and total deposits of $218.6 million. ...
The FDIC and MB Financial Bank entered into a loss-share transaction. MB Financial Bank will share in the losses on approximately $181 million in assets covered under the agreement. ...
The FDIC estimates that the cost to the Deposit Insurance Fund will be $41.6 million. MB Financial Bank's acquisition of all the deposits was the "least costly" resolution for the FDIC's Deposit Insurance Fund compared to alternatives. Heritage Community Bank is the fifteenth FDIC-insured institution to fail in the nation this year and the third in the state.
A comment on comments ...
by Calculated Risk on 2/27/2009 06:09:00 PM
The old comment system went down today. I switched over to the JS-Kit system and this is probably a permanent switch. The Haloscan system was no longer being improved, and JS-Kit has a number of new features in development.
There is a control feature at the bottom for threaded or flat comments. I'm still trying to figure everything out! Suggestions welcome ...
Now back to waiting for the FDIC.
Party Like It's ... 1996
by Calculated Risk on 2/27/2009 03:59:00 PM
The S&P 500 closed at 735 or so. The low in 1997 was 737.01.
Note: the S&P 500 was at 744 when Greenspan spoke of "irrational exuberance"!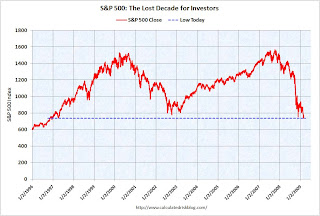 Click on graph for larger image in new window.
DOW off 1.6%
S&P 500 off 2.3%
NASDAQ off 1.0%
The second graph is from Doug Short of dshort.com (financial planner): "Four Bad Bears". (Doug should update soon)
Note that the Great Depression crash is based on the DOW; the three others are for the S&P 500.
California Unemployment Rate Hits Double Digits
by Calculated Risk on 2/27/2009 03:17:00 PM
From the LA Times: California unemployment rate reaches 10.1%
More than 1 in 10 California workers were unemployed in January ...Ouch.
The 10.1% jobless rate is the highest since June 1983 and not far below the 11% record set in November 1982 at the worst point of a severe recession ... Job losses escalated in January, with the state's unemployment rate jumping by 1.4 percentage points from a revised 8.7% for December.
Investment Contributions to GDP
by Calculated Risk on 2/27/2009 02:00:00 PM
The following graph shows the contribution to GDP from residential investment, equipment and software, and nonresidential structures. The graph shows the rolling 4 quarters for each investment category.
This is important to follow because residential tends to lead the economy, equipment and software is generally coincident, and nonresidential structure investment trails the economy. Click on graph for larger image in new window.
Residential investment (red) has been a huge drag on the economy for the last couple of years. The good news is the drag is getting smaller, and the drag on GDP will be significantly less in 2009, than in 2007 and 2008.
Even if there is no rebound in residential investment later this year, the drag will be less because there isn't much residential investment left! The bad news is any rebound in residential investment will probably be small because of the huge overhang of existing inventory.
The REALLY bad news is nonresidential investment (blue) is about to fall off a cliff. Nonresidential investment subtracted -0.24% (SAAR) from GDP in Q4, and will decline sharply in 2009 based on the Fed's Senior Loan Officer Survey, the Architecture Billings Index, and many many other reports and stories. In previous downturns the economy recovered long before nonresidential investment - and that will probably be true again this time.
As always, residential investment is the investment area to follow - it is the best predictor of future economic activity.
GE Cuts Dividend
by Calculated Risk on 2/27/2009 01:49:00 PM
This is a big story because it shows how quickly the economy has changed. Just last November, GE once again promised not to cut the dividend through the end of 2009.
From MarketWatch: GE to cut dividend to 10 cents from 31 cents: WSJ
General Electric will cut its quarterly dividend to 10 cents from 31 cents, the Wall Street Journal reported on its Web site Friday.And from GE last November: An update on the GE dividend
On Sept. 25, GE stated that its Board of Directors had approved management’s plan to maintain GE’s quarterly dividend of $0.31 per share, totaling $1.24 per share annually, through the end of 2009. That plan is unchanged.This dividend cut was inevitable. But hoocoodanode? Apparently not GE management.
The Stress Test Schedule
by Calculated Risk on 2/27/2009 12:05:00 PM
It has been widely reported that the stress tests will be completed "no later than the end of April", based on this FAQ:
Q10: When will the process be completed?Just to let everyone know, I've heard the banks have been told to submit their stress test results by Wednesday March 11th. Too bad the results will not be made public.
A: The Federal supervisory agencies will conclude their work as soon as possible, but no later than the end of April.
UPDATE: Questions from a reader:
Just to repeat the first question: With all that is happening in Asia and Europe (especially the exposure to Eastern Europe and other emerging markets), what are the macro assumptions for these markets? I'm sure other readers have excellent questions too.The Fed published macroeconomic assumptions for the US. What about international markets? Should the banks assume mark-to-market accounting will stay or will be repealed? Should the banks still assume that in 2010 they will have to bring off-balance sheet exposures back on their books?
Restaurant Performance Index Rebounds Slightly
by Calculated Risk on 2/27/2009 10:57:00 AM
From the National Restaurant Association (NRA): Restaurant Industry Outlook Improved Somewhat in January as Restaurant Performance Index Rebounded From December’s Record Low
The outlook for the restaurant industry improved somewhat in January, as the National Restaurant Association’s comprehensive index of restaurant activity bounced back from December’s record low. The Association’s Restaurant Performance Index (RPI) – a monthly composite index that tracks the health of and outlook for the U.S. restaurant industry – stood at 97.4 in January, up 1.0 percent from December’s record low level of 96.4.
“Despite the encouraging January gain, the RPI remained below 100 for the 15th consecutive month, which signifies contraction in the key industry indicators,” said Hudson Riehle, senior vice president of Research and Information Services for the Association. “Same-store sales and customer traffic remained negative in January, and only one out of four operators expect to have stronger sales in six months.”
...
Restaurant operators reported negative customer traffic levels for the 17th consecutive month in January.
...
Along with soft sales and traffic levels, capital spending activity remained dampened in recent months. Thirty-four percent of operators said they made a capital expenditure for equipment, expansion or remodeling during the last three months, matching the proportion who reported similarly last month and tied for the lowest level on record.
emphasis added
 Click on graph for larger image in new window.
Unfortunately the data for this index only goes back to 2002.
The index values above 100 indicate a period of expansion; index values below 100 indicate a period of contraction.
Based on this indicator, the restaurant industry has been contracting since November 2007. Also note the record low business investment by restaurant operators - this is happening in most industries, and is showing up as a significant decline in equipment and software investment in the GDP report (-28.8% annualized in the Q4 report!)
Citi Deal Details
by Calculated Risk on 2/27/2009 09:13:00 AM
From the NY Times: U.S. Agrees to Raise Its Stake in Citigroup
[T]he government will increase its stake in the company to 36 percent from 8 percent.From MarketWatch: Citi CEO says latest deal should end nationalization fear
...
Under the deal, Citibank said that it would offer to exchange common stock for up to $27.5 billion of its existing preferred securities and trust preferred securities at a conversion price of $3.25 a share, a 32 percent premium over Thursday’s closing price.
The government will match this exchange up to a maximum of $25 billion of its preferred stock at the same price. In its statement, the Treasury Department said the dollar-for-dollar match was intended to strengthen Citigroup’s capital base.
The government of Singapore Investment Corporation, Saudi Prince Walid bin Talal, Capital Research Global Investors and Capital World Investors have already agreed to participate in the exchange, Citibank said in a statement. Existing shareholders will own about 26 percent of the outstanding shares.
...
The bank will also suspend dividends on its preferred shares and its common stock.
"[F]or those people who have a concern about nationalization, this announcement should put those concerns to rest," Pandit said.Here is the Treasury statement: Treasury Announces Participation in Citigroup's Exchange Offering
GDP Revision: Q4 GDP Declined at 6.2%
by Calculated Risk on 2/27/2009 09:00:00 AM
From the WSJ: GDP Shrank 6.2% in 4th Quarter, Deeper Than First Thought
The U.S. recession deepened a lot more in late 2008 than first reported, according to government data showing a big revision down because businesses cut supplies to adjust for shriveling demand.I'll have more on investment, but this is more in line with expectations in Q4.
...
The sharply lower revision to a decline of 6.2% reflected adjustments downward of inventory investment, exports and consumer spending.
The report showed businesses inventories shrank $19.9 billion in the fourth quarter, instead of rising by $6.2 billion as Commerce originally estimated.
...
Fourth-quarter investment in structures decreased 5.9%. Equipment and software plunged 28.8%.
Report: Citi and U.S. Government Reach Agreement
by Calculated Risk on 2/27/2009 12:07:00 AM
From the WSJ: Citi, U.S. Reach Deal on Government Stake
... expected to be announced Friday morning ... the Treasury has agreed to convert some of its current holdings of preferred Citigroup shares into common stock ... The government will convert its stake only to the extent that Citigroup can persuade private investors such as sovereign wealth funds do so as well ... The Treasury will match private investors' conversions dollar-for-dollar up to $25 billion.MarketWatch has some details.
The size of the government's new stake will hinge on how many preferred shares private investors agree to convert into common stock. The Treasury's stake is expected to rise to up to 40% of Citigroup, the people said.


