by Calculated Risk on 4/03/2009 10:42:00 AM
Friday, April 03, 2009
Report: Banks Considering Gaming PPIP
The Financial Times reports: Bailed-out banks eye toxic asset buys (ht Scot)
US banks that have received government aid, including Citigroup, Goldman Sachs, Morgan Stanley and JPMorgan Chase, are considering buying toxic assets to be sold by rivals under the Treasury’s $1,000bn (£680bn) plan to revive the financial system.This is just a report, and it would appear to be inappropriate for any bank receiving TARP funds to buy "legacy assets" using the PPIP. My suggestion is to explicitly ban this activity to help build confidence in the PPIP.
The plans proved controversial, with critics charging that the government’s public-private partnership - which provide generous loans to investors - are intended to help banks sell, rather than acquire, troubled securities and loans.
...
The government plan does not allow banks to buy their own assets, but there is no ban on the purchase of securities and loans sold by others.
“It’s an open programme designed to get markets going,” a Treasury official said. But he added: “It is between a bank and their supervisor whether they are healthy enough to acquire assets,” raising the possibility regulators may prevent weak banks from becoming buyers.
Employment: Comparing Recessions and Diffusion Index
by Calculated Risk on 4/03/2009 09:36:00 AM
Note: earlier Employment post: Employment Report: 663K Jobs Lost, 8.5% Unemployment Rate and Part Time for Economic Reasons Hits 9 Million Click on graph for larger image in new window.
This graph shows the job losses from the start of the employment recession, in percentage terms (as opposed to the number of jobs lost).
For the current recession, employment peaked in December 2007, and this recession was a slow starter (in terms of job losses and declines in GDP).
However job losses have really picked up in recent months (red line cliff diving on the graph), and the current recession is now the worst recession in percentage terms since the 1950s - although not in terms of the unemployment rate.
In the early post-war recessions (1948, 1953, 1958), there were huge swings in manufacturing employment and that lead to larger percentage losses. For the current recession, the job losses are more widespread.
In March, job losses were large and widespread across the major industry sectorsHere is a look at how "widespread" the job losses are using the employment diffusion index from the BLS.
BLS, March Employment Report
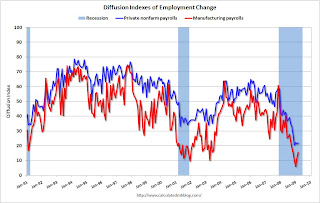 The BLS diffusion index is a measure of how widespread changes in employment are. Some people think it measures the percent of industries increasing employment, but that isn't quite correct.
From the BLS handbook:
The diffusion indexes for private nonfarm payroll employment are based on estimates for 278 industries, while the manufacturing indexes are based on estimates for 84 industries. Each component series is assigned a value of 0, 50, or 100 percent, depending on whether its employment showed a decrease, no change, or an increase over a given period. The average (mean) value is then calculated, and this percent is the diffusion index number.So it is possible for the diffusion index to increase (like manufacturing increased from 11.4 to 15.7) not because industries are hiring, but because fewer industries are losing jobs.
Think of this as a measure of how widespread the job losses are across industries. The further from 50 (above or below), the more widespread the job losses or gains reported by the BLS.
Before September, the all industries employment diffusion index was close to 40, suggesting that job losses were limited to a few industries. However starting in September the diffusion index plummeted. In December, the index hit 20.5, suggesting job losses were very widespread. The index has only recovered slightly since then (22 in March).
The manufacturing diffusion index has fallen even further, from 40 in May 2008 to just 6 in January 2009. The manufacturing index recovered slightly to 15.7 in March.
Part Time for Economic Reasons Hits 9 Million
by Calculated Risk on 4/03/2009 09:11:00 AM
From the BLS report:
In March, the number of persons working part time for economic reasons (some-times referred to as involuntary part-time workers) climbed by 423,000 to 9.0 million.
 Click on graph for larger image in new window.
Not only has the unemployment rate risen sharply to 8.5%, but the number of workers only able to find part time jobs (or have had their hours cut for economic reasons) is now at a record 9.0 million.
Of course the U.S. population is significantly larger today (about 305 million) than in the early '80s (about 228 million) when the number of part time workers almost reached 7 million. That is the equivalent of about 9.3 million today, so population adjusted this isn't quite a record - yet - but it is getting close.
And the rapid increase is stunning ...
Employment Report: 663K Jobs Lost, 8.5% Unemployment Rate
by Calculated Risk on 4/03/2009 08:30:00 AM
From the BLS:
Nonfarm payroll employment continued to decline sharply in March (-663,000), and the unemployment rate rose from 8.1 to 8.5 percent, the Bureau of Labor Statistics of the U.S. Department of Labor reported today. Since the recession began in December 2007, 5.1 million jobs have been lost, with almost two-thirds (3.3 million) of the decrease occurring in the last 5 months. In March, job losses were large and widespread across the major industry sectors.
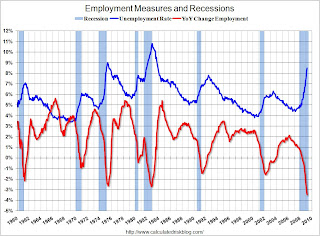 Click on graph for larger image.
This graph shows the unemployment rate and the year over year change in employment vs. recessions.
Nonfarm payrolls decreased by 663,000 in March. January job losses were revised to
741,000. The economy has lost almost 3.3 million jobs over the last 5 months, and over 5 million jobs during the 15 consecutive months of job losses.
The unemployment rate rose to 8.5 percent; the highest level since 1983.
Year over year employment is strongly negative (there were 4.8 million fewer Americans employed in Mar 2009 than in Mar 2008). This is another extremely weak employment report ... more soon.
Thursday, April 02, 2009
Office Vacancy Rate Rises to 15.2% in Q1
by Calculated Risk on 4/02/2009 09:09:00 PM
From the WSJ: Companies Sold Office Space at a Fast Pace
Companies struggling to cut costs dumped a near-record 25 million square feet of office space in the first quarter, driving vacancy up and rents down, according to data to be released today by Reis Inc.
...
The office vacancy rate nationwide rose to 15.2% from 14.5% in the previous quarter, and likely will surpass 19.3% over the next year, according to Reis, a New York firm that tracks commercial property. That would put the vacancy rate above the level during the real-estate bust of the early 1990s, the worst on record.
 Click on graph for larger image in new window.
This graph shows the office vacancy rate starting 1991.
A little over one month ago, REIS was forecasting office vacancy rates would reach 17.6% in 2010. Now they are forecasting 19.3%!
Homeowner-Aid: When Interests Collide
by Calculated Risk on 4/02/2009 07:34:00 PM
From Ruth Simon and Michael Phillips at the WSJ: Homeowner-Aid Plan Caught in Second-Loan Spat
The Obama administration's $75 billion effort to help troubled homeowners avoid foreclosure has hit a stumbling block: a fight over how to aid borrowers who have more than one home loan.This refers to Part II of the Obama plan - under Part II the lender must bring the total monthly payments on mortgages to 38% of the borrowers gross income, and then the U.S. will match dollar for dollar from 38% down to 31% debt-to-income ratio for the borrower. But it was never clear what happens if the borrower had a 2nd mortgage. The only references in Part II to 2nd liens was in the Home Affordable Modification Program Housing Counselor Q&As:
...
One problem is that first and second mortgages are often owned by different parties and may be handled by different mortgage servicers, the companies that collect checks from the borrowers.
What if the borrower has a second mortgage and would like to apply for a Home Affordable Modification?That definitely isn't very clear, and most 2nd lien holders wouldn't want to take $1,000. As the WSJ notes:
Under the Home Affordable Modification program, junior lien holders will be required to subordinate to the modified loan. However, through the Home Affordable Modification an incentive payment of up to $1,000 is available to pay off junior lien holders. Servicers are eligible to receive an additional $500 incentive payment for efforts made to extinguish second liens on loans modified under this program.
Banks and other financial institutions own as much as 90% of the $1.08 trillion in home-equity loans and lines of credit in the marketplace ... Bank of America Corp., Wells Fargo & Co., J.P. Morgan Chase & Co. and Citigroup Inc. have the largest home-equity portfolios, SMR said.And here is one possibility being discussed:
...
"We are going to have to take a haircut on the second" lien, said one bank executive. "But we don't think we should get wiped out."
One proposal would require lenders to cap monthly payments on second loans at a set percentage of the borrower's gross income. The lender would be expected to "eat the vast majority" of the cost, with the government subsidizing a small portion ...Conflicting interests ... what a surprise.
More Stories of Falling Apartment Rents
by Calculated Risk on 4/02/2009 06:34:00 PM
From Amanda Fung at Crain's on New York: Big landlord takes hit on falling apt. rents (ht Jennifer)
Declining Manhattan rents are taking a toll on Equity Residential, a large real estate investment trust that owns 47 apartment buildings in the New York metropolitan area.And in San Diego from Zach Fox at the NC Times: HOUSING: Rents falling as vacancies rise at major complexes
...
Since February alone, Equity Residential has lowered its Manhattan asking rents by an average of 13%, said Michael Levy, an analyst at Macquarie. That reduction came on top of a 15% cut over the previous year.
A handful of big local apartment complexes have cut rents in an attempt to fill empty units ...
Tradition, an apartment complex near the Aviara Golf Course in Carlsbad, has cut its asking rent for a three-bedroom apartment from $2,015 to $1,799 per month, said Kris Nelson, business manager for the complex.
Tradition has seen its vacancy rate rise from a fairly consistent 3 percent to 8 percent recently, Nelson said.
...
In Temecula, Somerset Apartments has seen its vacancy rate shoot up from 3 percent to 20 percent. Managers responded by slashing rents by 25 percent for two bedroom, two bath apartments ---- from $1,200 to $900 per month.
Markets: Another Day at the Casino
by Calculated Risk on 4/02/2009 04:00:00 PM
These swings are wild ...
DOW just below 8,000, up 2.8%
S&P 500 up 2.9%
NASDAQ up 3.3% Click on graph for larger image in new window.
This graph is from Doug Short of dshort.com (financial planner): "Four Bad Bears".
This is the 2nd worst S&P 500 / DOW bear market in the U.S. in 100 years.
Note that the Great Depression crash is based on the DOW; the three others are for the S&P 500.
The Financial Crisis: An Inside View
by Calculated Risk on 4/02/2009 03:24:00 PM
Here is the link to the essay by Phillip Swagel (excerpts in previous post): The Financial Crisis: An Inside View (ht Clay)
Former Treasury Assistant Secretary writes: "What was going on?"
by Calculated Risk on 4/02/2009 01:08:00 PM
From the WSJ: Paulson Expected Criticism for Changing Course on TARP (ht Belinda)
Phillip Swagel, who was assistant Treasury secretary for economic policy under Henry Paulson ... in a 50-page essay to be presented Friday at the Brookings (Institution) Panel on Economic Activity ... says his former boss "truly meant" to the use the $700 billion that Congress gave him to buy assets from banks, not to buy shares, and knew he would be criticized when he changed course late last year in the face of a deteriorating economy and deepening banking crisis.And the WSJ Real Time Economics has a few excerpts from the essay: What Was Going on Inside the Paulson Treasury?
Here is a short excerpt from the excerpts:
This shows three of the key problems with the Paulson Treasury:The Treasury predicted in May 2007 that “we were nearing the worst of it in terms of foreclosure starts” and the problem would subside after a peak in 2008. “What we missed is that the regressions didn’t use information on the quality of the underwriting of subprime mortgages in 2005, 2006 and 2007,” Swagel said — Federal Deposit Insurance Corp. staff pointed that out at the time. The ill-fated 2007 Treasury proposal to create a privately funded entity — called MLEC, or Master Liquidity Enhancement Conduit – to buy up toxic assets from the banks was developed by the Treasury’s Office of Domestic Finance and shared with market participants without involvement from other Treasury senior staff. “The MLEC episode looked to the world and to many within Treasury like a basketball player going up in the air to pass without an open teammate in mind — a rough and awkward situation,” he said. Paulson “truly meant” to the use the $700 billion in TARP money to buy assets from the banks, not to buy shares in the banks, because he saw it as “a fundamentally bad idea to have the government involved in the ownership of banks.” He changed is mind when markets deteriorated and “he well understood that directly adding capital to the banking system provided much greater leverage.”
1) Paulson didn't understand the problem until very late:
Paulson also said the fallout in subprime mortgages is "going to be painful to some lenders, but it is largely contained."2) The ill-fated MLEC, and three page initial TARP proposal showed poor planning and coordination.
March 13, 2007
"All the signs I look at" show "the housing market is at or near the bottom," Paulson said.
April 20, 2007
"In terms of looking at housing, most of us believe that it's at or near the bottom," [Paulson] told Reuters. "It's had a significant impact on the economy. No one is forecasting when, with any degree of clarity, that the upturn is going to come other than it's at or near the bottom."
July 2, 2007
“The MLEC episode looked to the world and to many within Treasury like a basketball player going up in the air to pass without an open teammate in mind — a rough and awkward situation.”3) Paulson was blinded by ideological concerns. The FDIC effectively takes over failed banks all the time, but somehow Paulson saw this as a "fundamentally bad idea".
Assistant Treasury secretary Phillip Swagel
Hopefully the entire essay will be available online.
Credit Crisis Indicators
by Calculated Risk on 4/02/2009 01:02:00 PM
Here is a quick look at a few credit indicators:
First, the British Bankers' Association reported that the three-month dollar Libor rates were fixed at 1.166%. The LIBOR was at 1.30% a couple of weeks ago, and peaked at 4.81875% on Oct 10, 2008. This is near the January 14th low of 1.0825%. Click on graph for larger image in new window.
The first graph shows the spread between 30 year Moody's Aaa and Baa rated bonds and the 30 year treasury.
There has been some increase in the spread the last few weeks, but the spread is still below the recent peak. The spreads are still very high, even for higher rated paper, but especially for lower rated paper.
Of course the default risk has increased significantly, especially for lower rated paper. Yesterday, Moody's warned of the worst corporate default rate since at least WWII.
Corporate America's credit quality collapsed in the first quarter, with Moody's Investors Service downgrading an estimated $1.76 trillion of debt, a record high ... The downgrades included a record number to the lowest rating categories, signaling the approach of the worst defaults since at least World War Two, Moody's chief economist John Lonski said in an interview.The Moody's data is from the St. Louis Fed:
emphasis added
Moody's tries to include bonds with remaining maturities as close as possible to 30 years. Moody's drops bonds if the remaining life falls below 20 years, if the bond is susceptible to redemption, or if the rating changes.
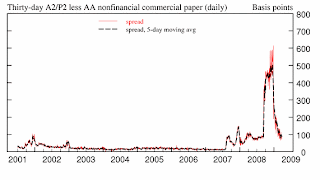 There has been improvement in the A2P2 spread. This has declined to 0.93. This is far below the record (for this cycle) of 5.86 after Thanksgiving, but still above the normal spread.
This is the spread between high and low quality 30 day nonfinancial commercial paper.
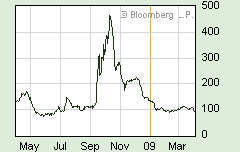 | Meanwhile the TED spread has decreased further over the last week, and is now at 95.3. This is the difference between the interbank rate for three month loans and the three month Treasury. The peak was 463 on Oct 10th and a normal spread is around 50 bps. |
 This graph shows the at the Merrill Lynch Corporate Master Index OAS (Option adjusted spread) for the last 2 years.
This is a broad index of investment grade corporate debt:
The Merrill Lynch US Corporate Index tracks the performance of US dollar denominated investment grade corporate debt publicly issued in the US domestic market.The recent surge in this index was a cause for alarm, but the index appears to have stabilized - and has declined over the last week.
All of these indicators are still too high, but there has been some progress.
Hotel Occupancy: RevPAR Off 20%
by Calculated Risk on 4/02/2009 11:08:00 AM
First a quote:
"The deteriorating trends in revenue and earnings ... accelerated during the first quarter of 2009. We expect this situation to continue as long as competitors in the Las Vegas market follow a strategy of sacrificing ADR (average daily room rate) to maximize room occupancy ... " emphasis addedIt's not just in Las Vegas ...
William L. Westerman, CEO, Riviera Holdings Corp, March 31, 2009
From HotelNewsNow.com: STR reports U.S. data for week ending 28 March
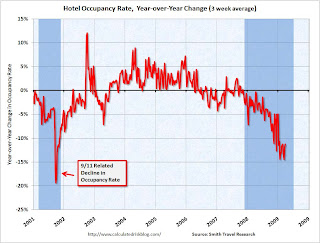
In year-over-year measurements, the industry’s occupancy fell 12.3 percent to end the week at 56.6 percent (64.6 percent in the comparable week in 2008). Average daily rate dropped 8.8 percent to finish the week at US$99.77 (US$109.34 in the comparable week in 2008). Revenue per available room for the week decreased 20.0 percent to finish at US$56.50 (US$70.61 in the comparable week in 2008).
 Click on graph for larger image in new window.
This graph shows the YoY change in the occupancy rate (3 week trailing average).
The three week average is off 11.3% from the same period in 2008.
The average daily rate is down 8.8%, so RevPAR (Revenue per available room) is off 20.0% from the same week last year.
FASB on Mark-to-Market Rules
by Calculated Risk on 4/02/2009 09:18:00 AM
From Bloomberg: FASB Eases Fair-Value Rules Amid Lawmaker Pressure (ht Mark)
... The changes approved today to fair-value, also known as mark-to-market, allow companies to use “significant” judgment in valuing assets to reduce writedowns on certain investments, including mortgage-backed securities. Accounting analysts say the measure, which can be applied to first-quarter results, may boost banks’ net income by 20 percent or more. FASB approved the changes during a meeting in Norwalk, Connecticut.Update: From Housing Wire:
If you read the headlines (and most people don’t bother to go much farther beyond the headline than the lead paragraph –- to our collective disgrace), you already think FASB eased the rules for measuring fair value on Thursday. You might believe that it has at last caved in to pressure from banks and Congress, and decided to allow “preparers” and their auditors to use judgment when valuing illiquid assets.
Not so. They are reiterating for the third time that “fair value is the price that would be received to sell the asset in an orderly transaction (that is, not a forced liquidation or distressed sale) between market participants at the measurement date.”
And for the second time it is “highlighting and expanding on the relevant principles in FAS 157 that should be considered in estimating fair value when there has been a significant decrease in market activity for the asset.”
The first time, of course, was when they issued FAS 157. The second is the SEC/FASB staff clarifications on fair value accounting issued September 30, 2008. This is the third statement, second clarification and expansion.
Monster Employment Index Declines in March
by Calculated Risk on 4/02/2009 08:44:00 AM
"The decline in U.S. online recruitment activity during March was a sober follow-up to February’s seasonal rise, as uncertainty in the future economic situation continued to keep employers on the sidelines of the hiring field.”From Monster.com: Monster Employment Index Dips Slightly in March
Jesse Harriott, senior vice president, Monster Worldwide April 2, 2009
The Monster Employment Index fell 4 points in March, and is now down 29% year-over-year, indicating a continued deceleration in online recruitment activity at the end of the first quarter.Just another indicator showing substantial weakness in the job market.
The ADP report showed private employment decreased 742,000 from February to March 2009. The weekly initial unemployment claims report showed insured unemployment is at a record 5.73 million, and initial weekly claims at a cycle high of 669 thousand.
The BLS report for March will be released tomorrow. The consensus is for a decline of 650 thousand in payroll employment ... I'll take the under.
Unemployment Insurance: More Weakness
by Calculated Risk on 4/02/2009 08:30:00 AM
The DOL reports on weekly unemployment insurance claims:
In the week ending March 28, the advance figure for seasonally adjusted initial claims was 669,000, an increase of 12,000 from the previous week's revised figure of 657,000. The 4-week moving average was 656,750, an increase of 6,500 from the previous week's revised average of 650,250.
...
The advance number for seasonally adjusted insured unemployment during the week ending March 21 was 5,728,000, an increase of 161,000 from the preceding week's revised level of 5,567,000.
 Click on graph for larger image in new window.
This graph shows weekly claims and continued claims since 1971.
The four week moving average is at 656,750. The record was 674,250 in 1982, although that was much higher as a percent of covered employment (covered employment was 87.6 million in 1982 compared to 133.9 million today).
Continued claims are now at 5.73 million - the all time record.
Note: I'll add the normalized graph next week. This is another very weak report and shows continued weakness for employment.
LA Times on Jim the Realtor
by Calculated Risk on 4/02/2009 12:40:00 AM
From Peter Hong at the LA Times: The Hunter S. Thompson of real estate
Real estate salesman Jim Klinge ... has become a notorious Internet chronicler of the real estate crash in north San Diego County, where he has lived and worked for decades.Here is one of my favorites - Jim the Realtor showcases an investment opportunity in San Diego - enjoy!
Rather than downplay the greed and excess that caused the region's travails, he revels in exposing them.
He surveys the wreckage with a pocket video camera, shooting footage of vacant, once-pricey houses turned into eyesores, voiced over with his deadpan narration. Then he posts them on his website, at www.bubbleinfo.com.
They're shaky, noisy clips full of coarse images and language.
More from the LA Times:
In one clip, the camera pans across the kitchen of a million-dollar fixer near Interstate 5. He pointedly notes the house's proximity to the freeway, which he calls the "De-troit river." There's mold under the sink and a foot-sized hole in the drywall just above the floor.I really enjoy Jim's videos ... Here is a compilation video Jim posted today:
"December 2006 this house sold for a million dollars," he says. "Nineteen hundred square feet, built in '78, right across the freeway. One million."
...
His wife, Donna, who helps manage the family brokerage, was nervous. "He was really pushing the envelope with the blog, taking people on, naming names," she said. "I took deep breaths. I didn't know how it would turn out."
She said she was shocked one day to see a photo on the blog of two young men sitting on the floor of a house with their wrists bound like prisoners. They had been squatting in a foreclosed house Jim was selling, and he had sneaked up on them as they slept and tied them up with plastic zip ties in a brazen citizen’s arrest.
Wednesday, April 01, 2009
NPR: Anatomy Of A Bank Takeover
by Calculated Risk on 4/01/2009 10:59:00 PM
From NPR (with Chicago Public Radio: This American Life), here is a story about the FDIC takeover of Bank of Clark County: Anatomy Of A Bank Takeover (ht Ted)
Here is the audio from NPR.
Here is the FDIC announcement from January: Umpqua Bank Acquires the Insured Deposits of Bank of Clark County, Vancouver, WA
 | At least they get free ice cream! Click on photo for larger image in new window. Photo Credit: Otishertz, January 2009 |
Auto Sales: Ray of Sunshine?
by Calculated Risk on 4/01/2009 08:25:00 PM
In Looking for the Sun, I suggested there might be three areas to look for "rays of sunshine in a very dark season": housing starts, new home sales, and auto sales.
Just like for housing starts and new home sales, it is way too early to call a bottom for auto sales - but it does look like vehicle sales increased in March on a seasonally adjusted annual rate (SAAR) basis.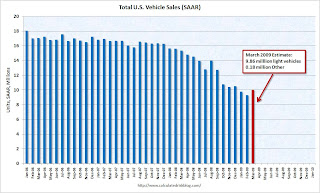 Click on graph for larger image in new window.
This graph shows the historical vehicle sales from the BEA (blue) and an estimate for March (light vehicle sales of 9.86 million SAAR from AutoData Corp).
Note: this graph includes a small number of heavy vehicle sales to compare to the BEA.
From the WSJ: Auto Makers See a Ray of Hope
The annualized sales pace ... came in at 9.86 million vehicles, well below the 16 million or more the industry typically logged a few years ago, but up from February's pace of 9.12 million.Even if this is the bottom for auto sales (way too early to call), the pickup will probably be very sluggish - especially considering the grim unemployment news and continuing financial crisis.
"I believe we are in a bottoming process for the industry," Bob Carter, a group vice president at Toyota Motor Corp., said in a conference call. ...
Michael DiGiovanni, the top sales analyst at General Motors Corp., said he expects a "very, very gradual pickup" in vehicle sales in the second quarter. He cited "the first signs of brightening" in the market. ...
Moody's Warns of Worst Corporate Default Rate since WWII
by Calculated Risk on 4/01/2009 06:09:00 PM
From Reuters: Moody's downgraded $1.76 trln U.S. corp debt in Q1
... Moody's Investors Service downgrading an estimated $1.76 trillion of debt, a record high ...Hopefully the bank stress tests have all these defaults factored in ...
The downgrades included a record number to the lowest rating categories, signaling the approach of the worst defaults since at least World War Two ...
"The most prominent new driving force behind credit rating reductions would be deterioration of commercial real estate," [Moody's chief economist John Lonski] said. ...
Moody's has forecast that the U.S. default rate will peak around 14.5 percent in November.
emphasis added
Moody's: Record High Credit Card Charge-Offs
by Calculated Risk on 4/01/2009 05:57:00 PM
From Reuters: Credit card charge-offs hit record high -Moody's (ht Brad)
Credit card write-downs soared to record levels in February, representing an all-time high in the 20-year history of the Moody's Credit Card Index ....Moody's reported the charge-off rate at 5.59% in February 2008, and 4.51% in February 2007.
Credit card charge-offs, the write-down of uncollectable debt, advanced decisively to 8.82 percent in February, marking the sixth consecutive month of increases. The level, is more than 300 basis points higher than a year ago.
...
[Moody's] predicts the charge-off rate index will peak at about 10.5 percent in the first half of 2010, assuming a coincident unemployment rate peak at 10 percent.


